Analysis
Predicted level, painted across every area.
A live heatmap of predicted sound level across every area. Drag a speaker and the map follows. Set a target for each area, and the advisor says how many speakers it takes to reach it.
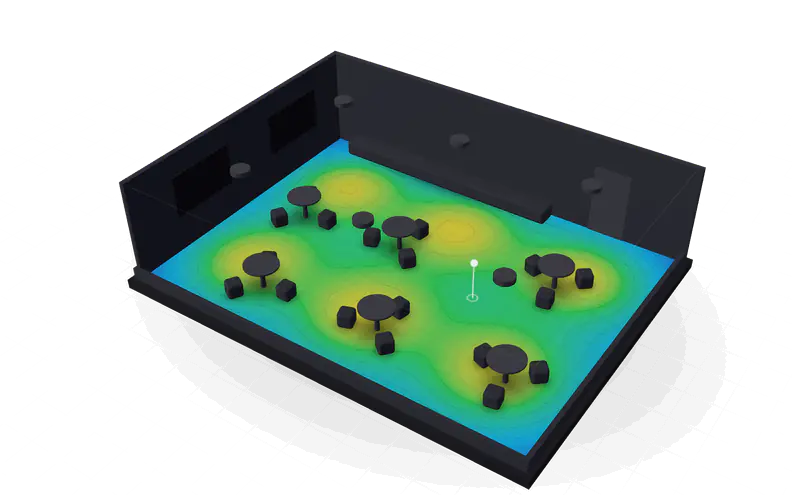
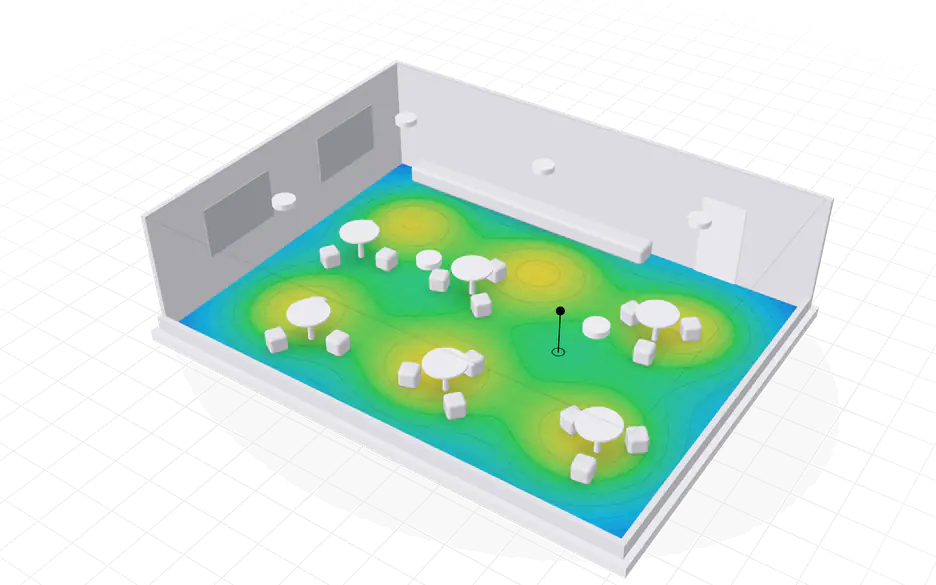
reading the map
Read it like a weather map.
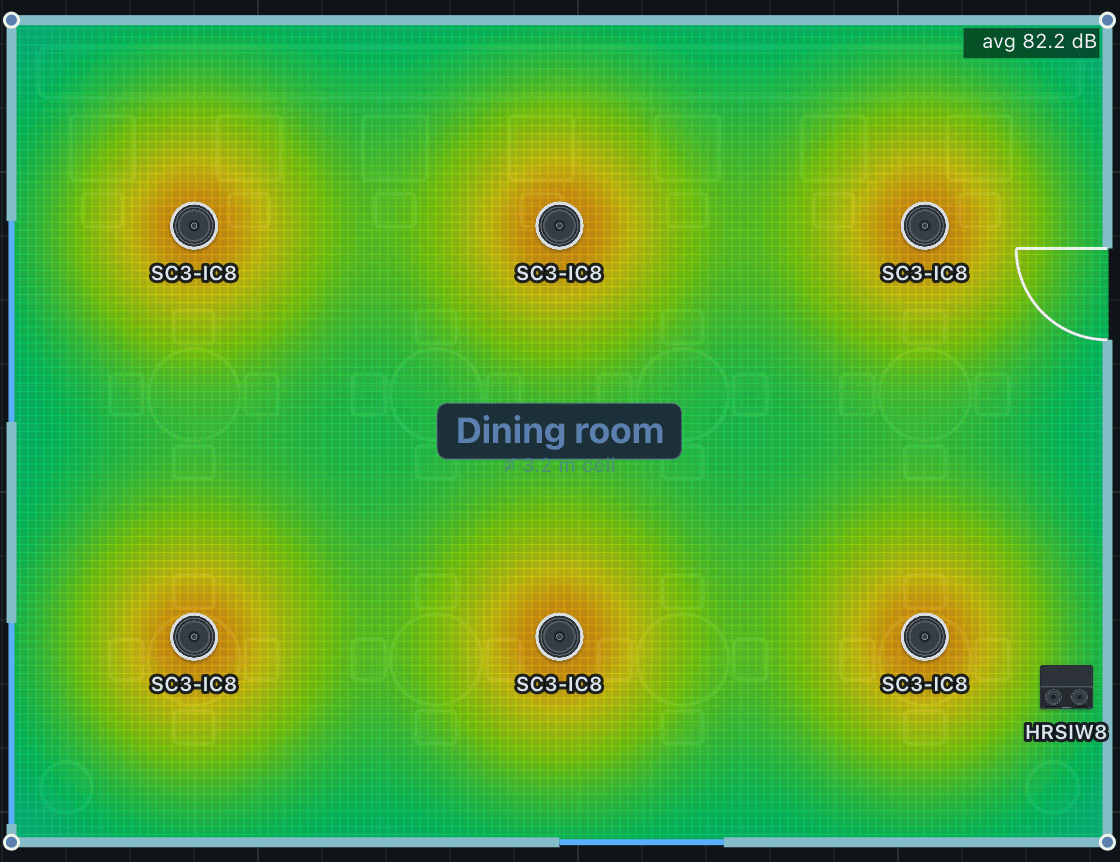
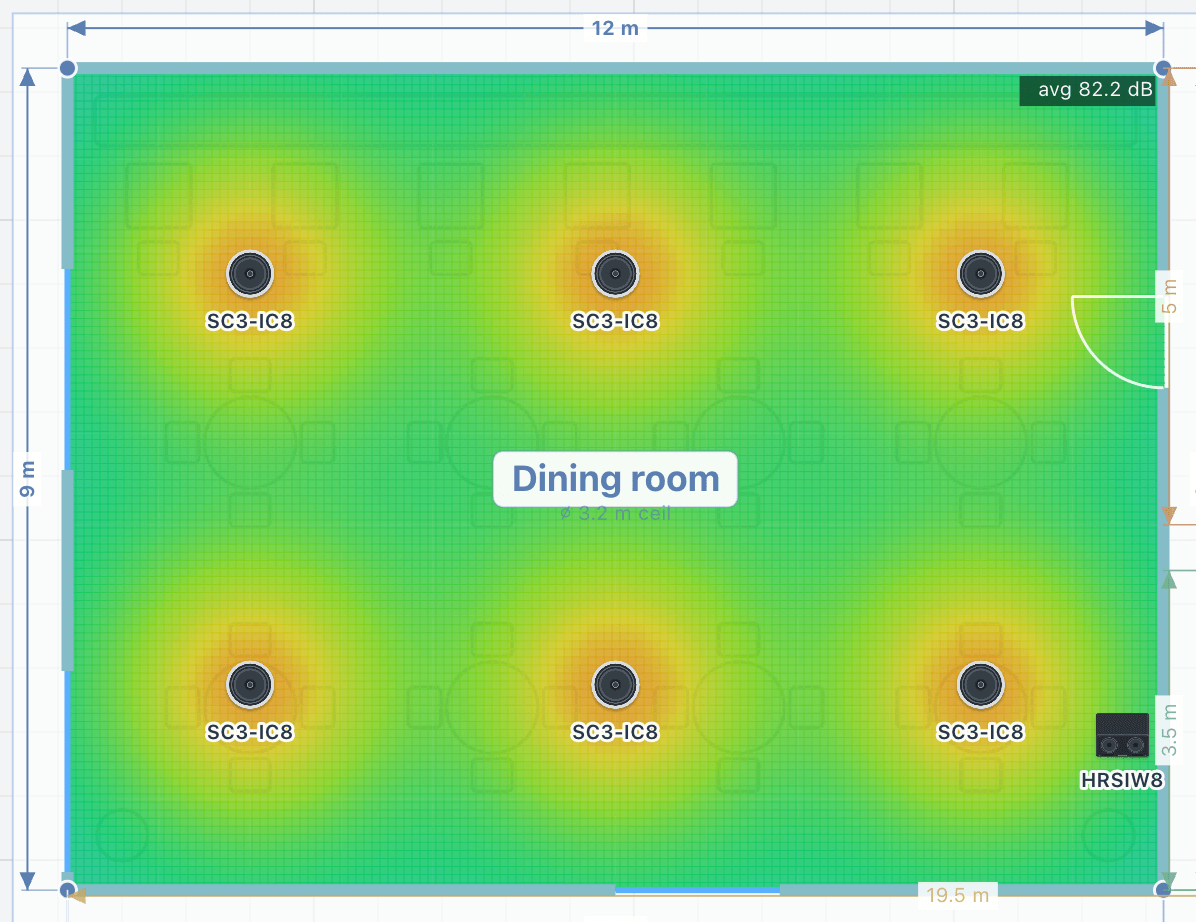
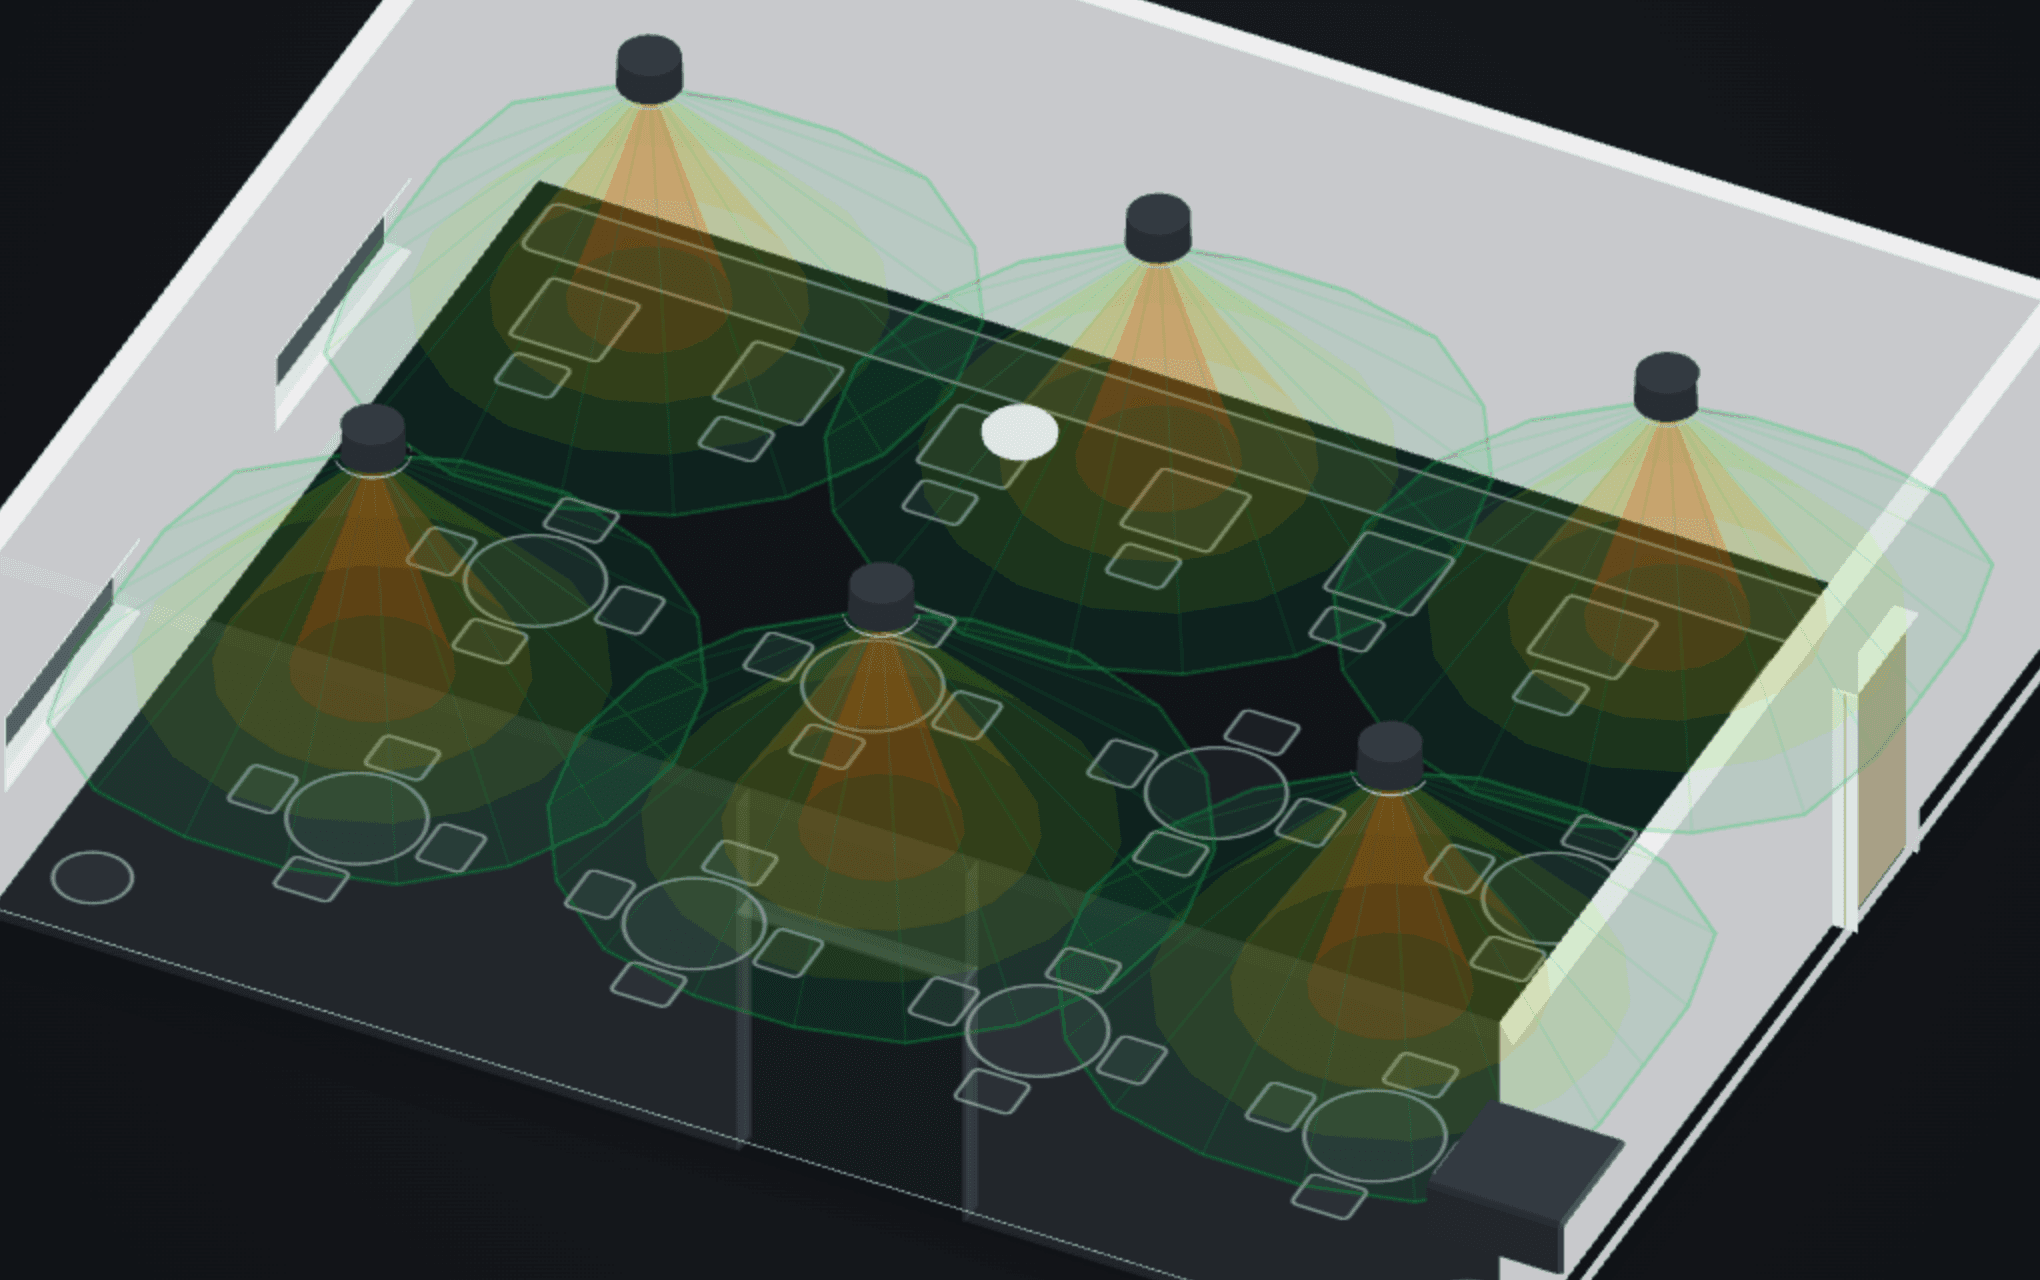
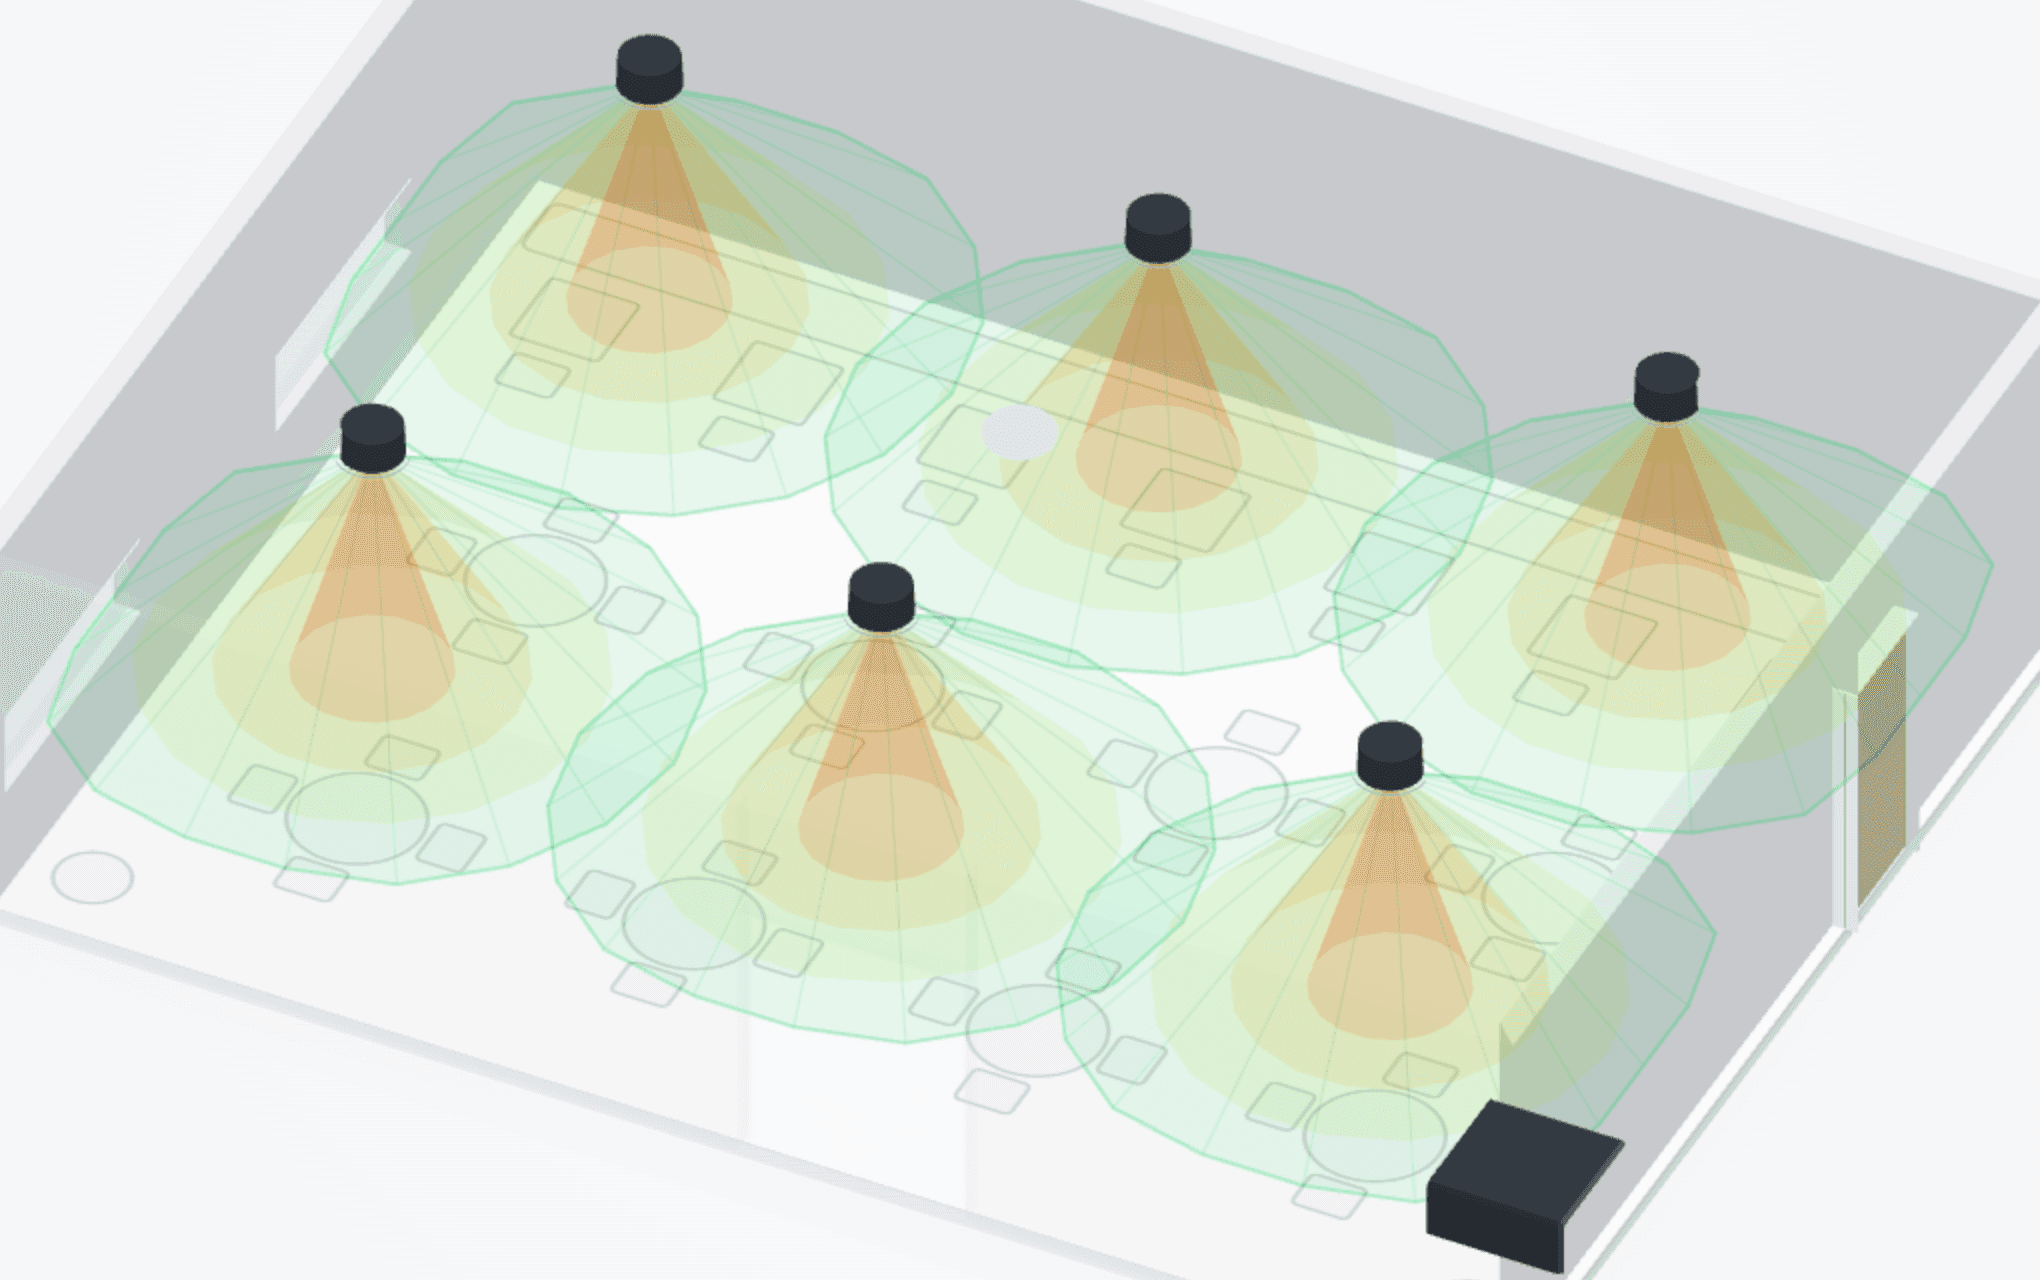
The heatmap paints the predicted level, in dB SPL, across the floor at ear height. Warm colours are loud and cool colours are quiet: red and orange near a speaker, green and yellow in the comfortable listening zone, blue where the level falls away in the corners.
Good coverage is mostly green to yellow across the seating, with no large blue gaps and no tight red hot spots. Narrow the scale, to 75 to 90 dB for example, and small differences become obvious; widen it for the general picture. The default runs from 80 to 110 dB.
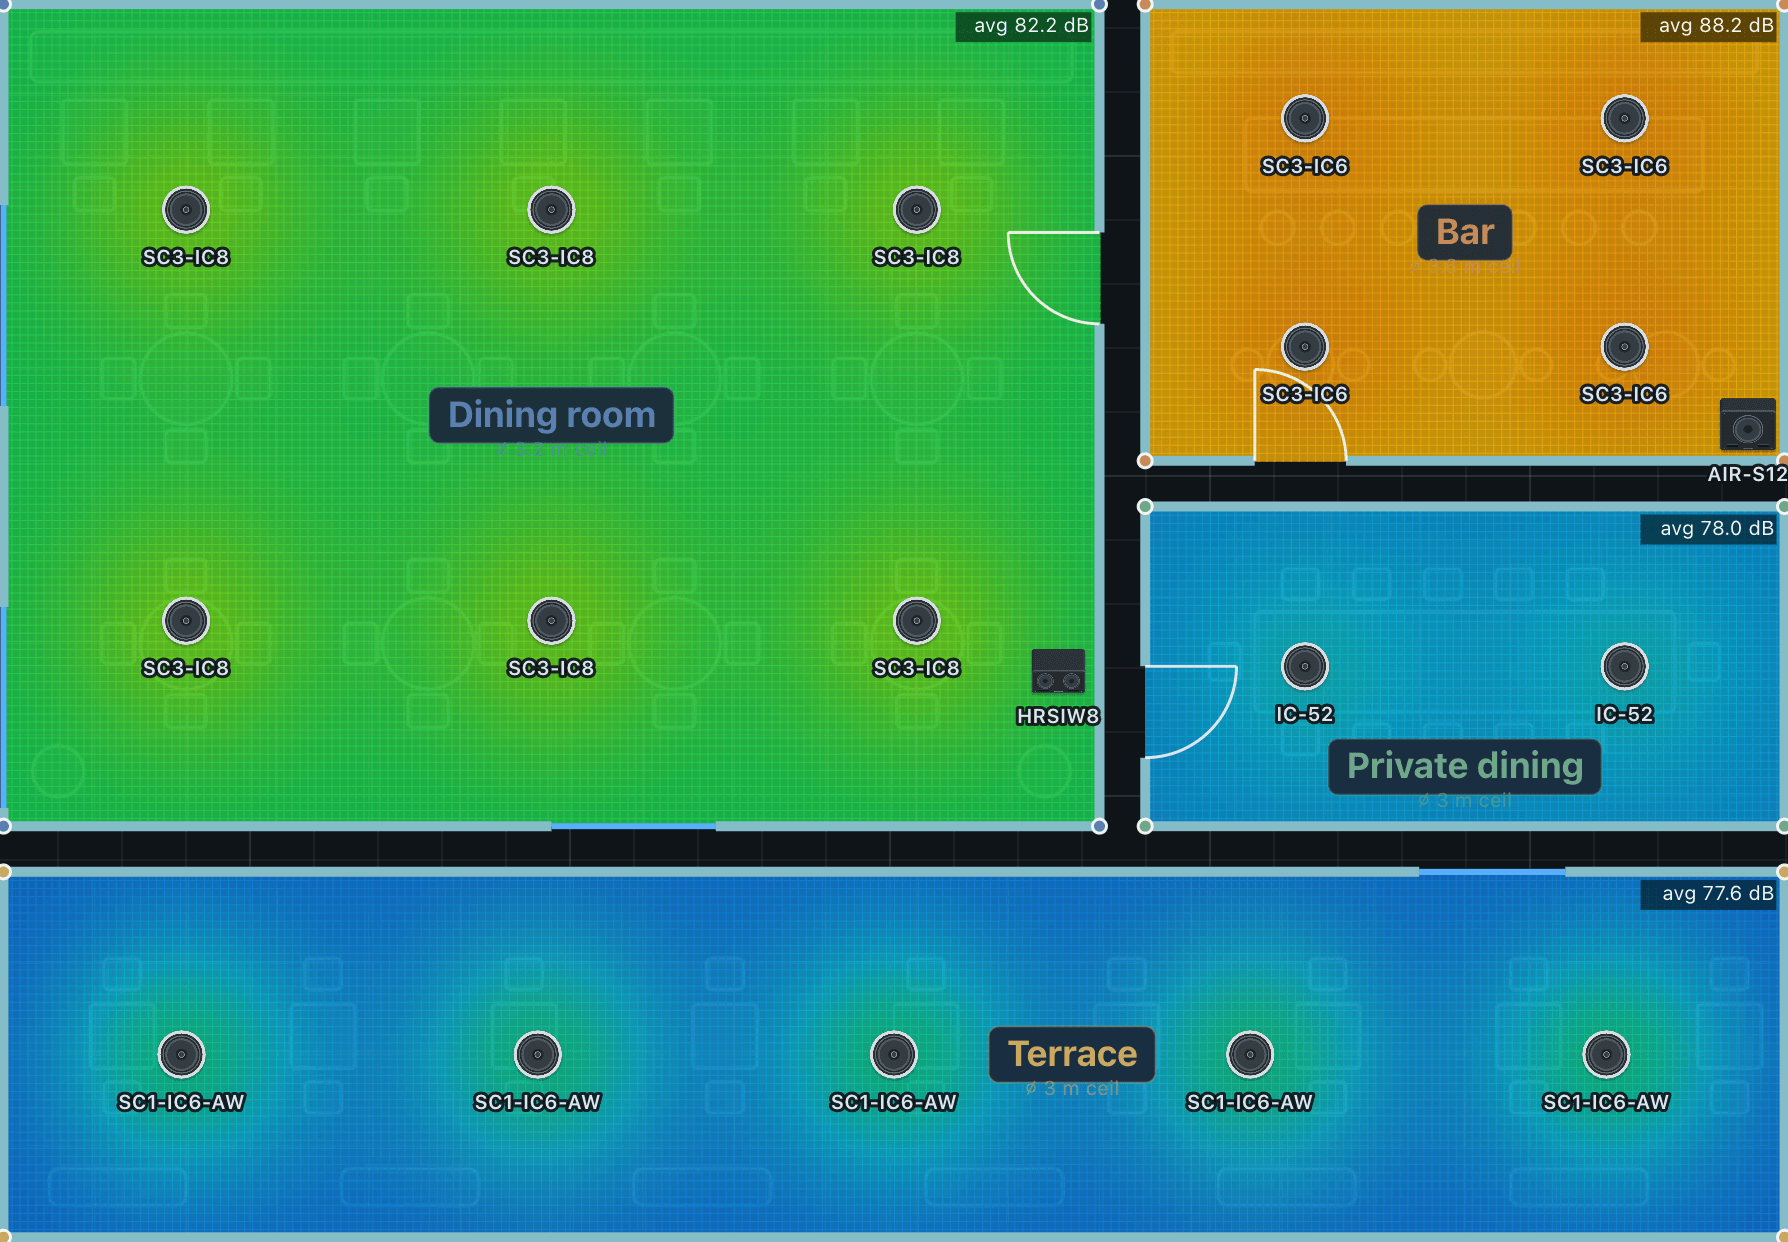
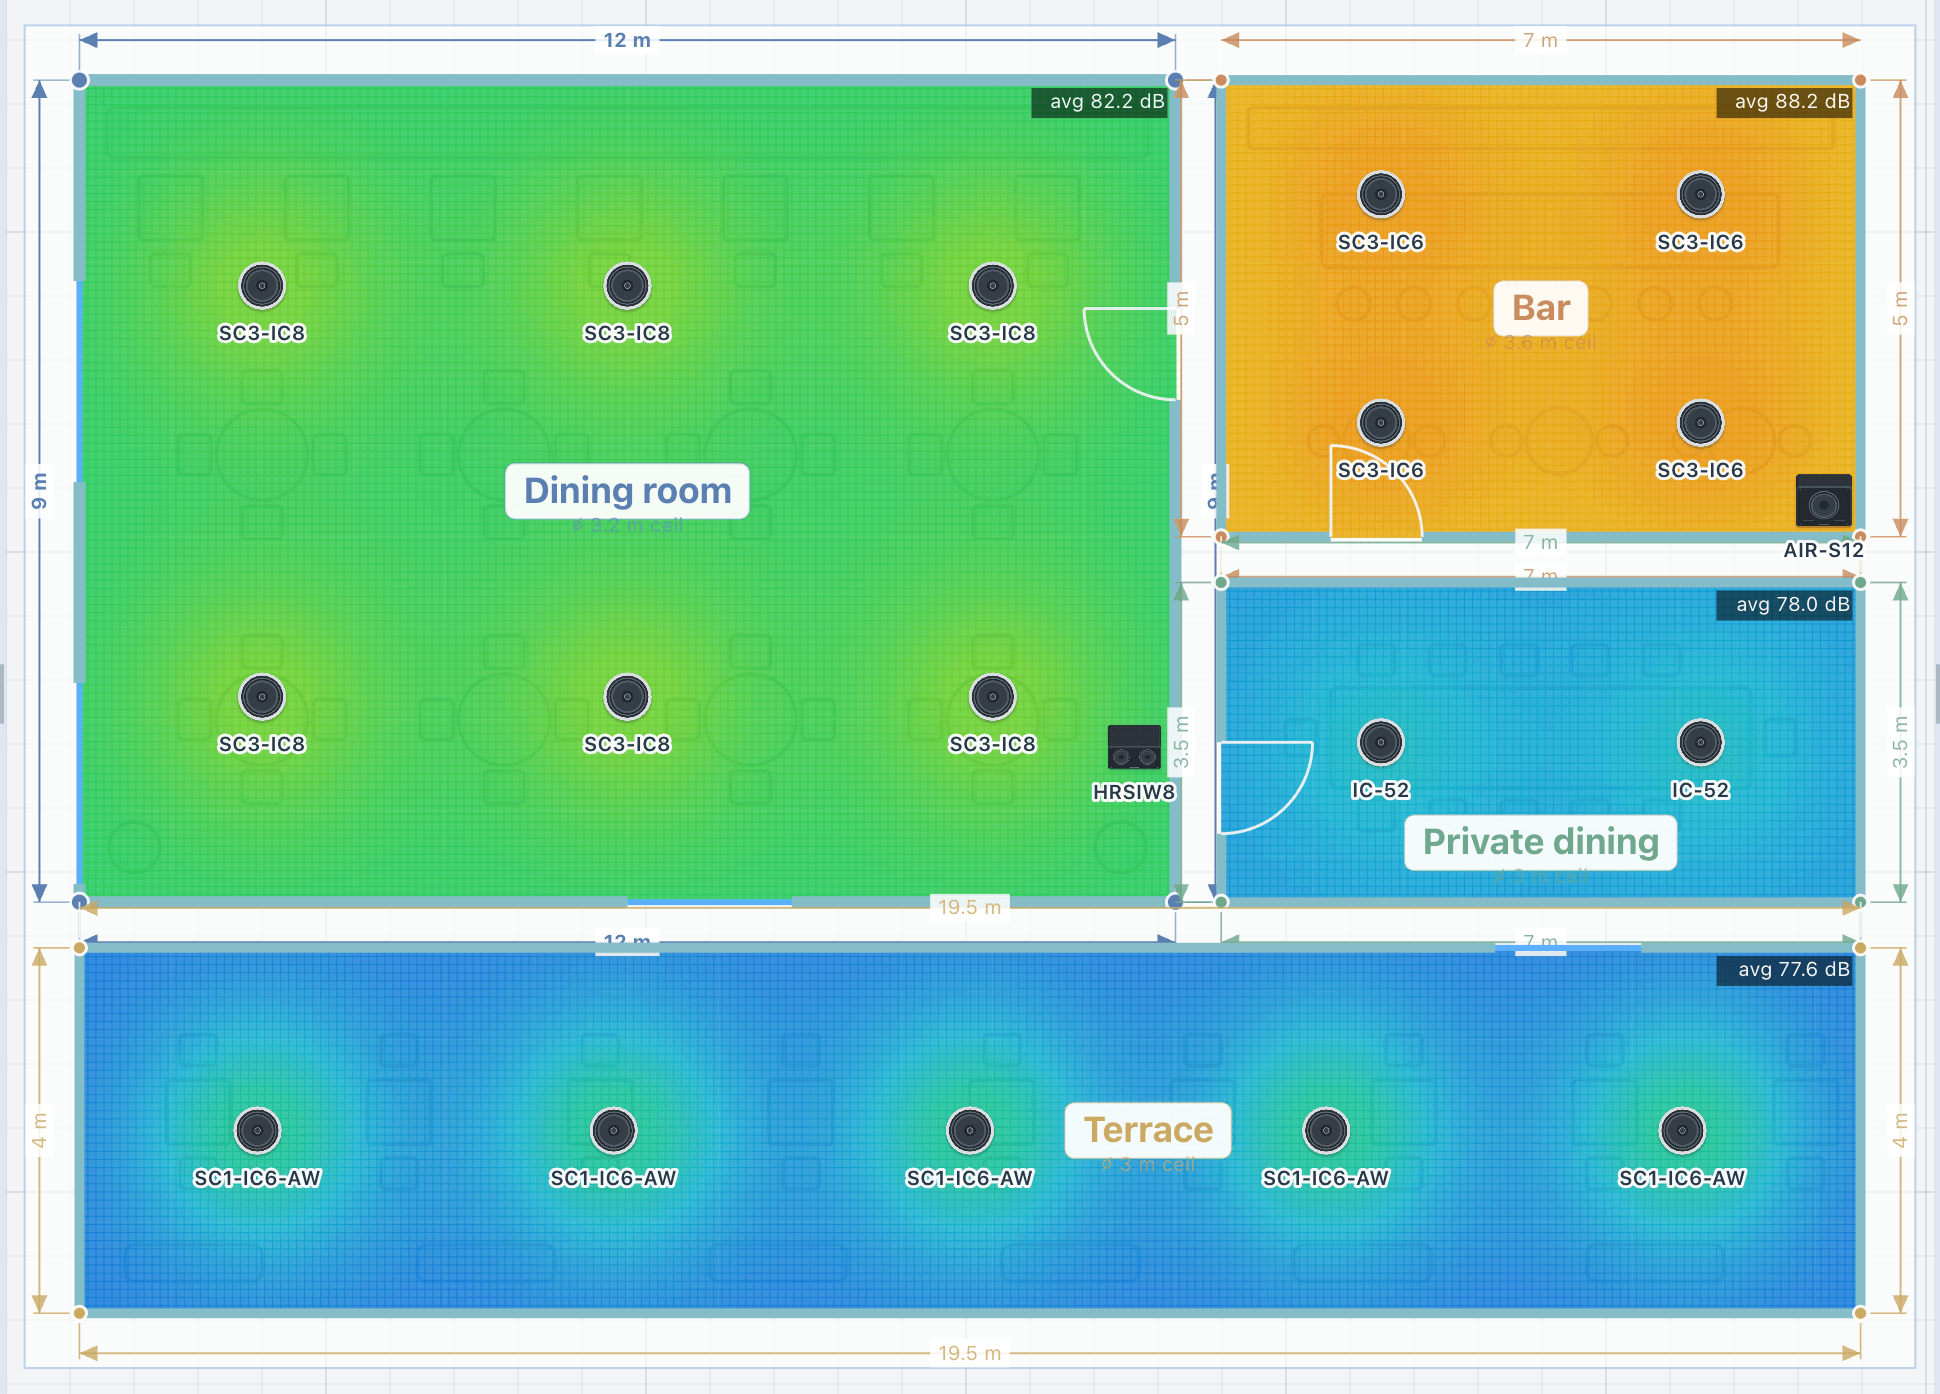
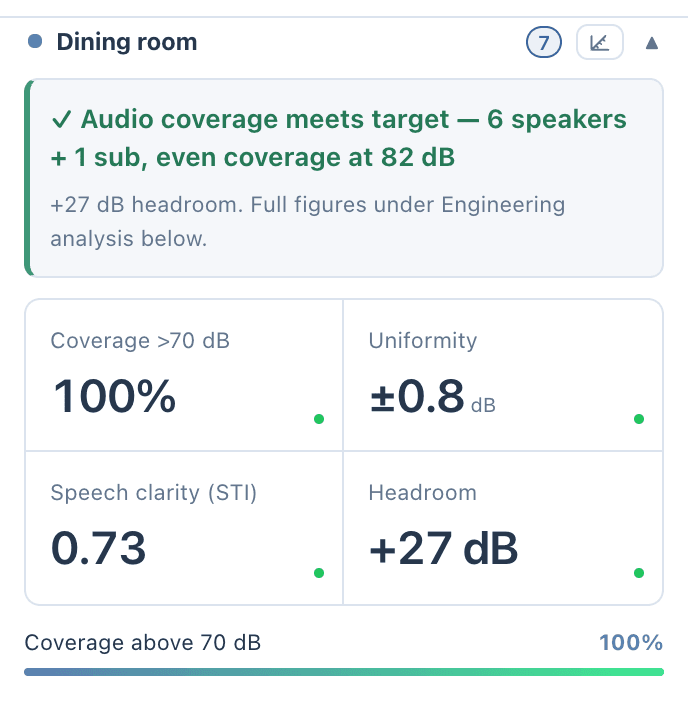
Each area card sums up what the colours show: the minimum, maximum and average level, the uniformity as a spread in ± dB (smaller is more even), and STI.
live
Drag a speaker, and the map follows.
The engine keeps each speaker’s field ready, so the heatmap recalculates in milliseconds and updates while you drag. Coverage cones show one speaker at a time, coloured from red on axis to green at its useful edge; the heatmap is the combined level of every speaker in the area. Use the cones to aim one speaker and the heatmap to judge the room.
Contours draw lines of equal level, like height lines on a map. The SPL and D/R switch turns the map into the direct-to-reverberant ratio, which tracks clarity in a reverberant room. Interference swaps energy summation for coherent summation, so you see the comb-filter peaks and nulls where speakers overlap; leave it off for layout decisions.
how it works
Compare levels across the room, not only near a speaker.
Read the coverage and resultsTask guide 06 · 3 min
Check the room and its target
Select the area and choose Edit area. Check Length, Width, Ceiling, Ear level and RT60. Close the editor, then open Results → Target & playback to review the required sound level.
Read the heatmap scale
In Layers, enable SPL heatmap and Coverage circles. Expand Heatmap Scale in the Inspector and compare the occupied area with its dB legend. Look for quiet gaps and excessive overlap.
Refine and review
Adjust one speaker at a time, then compare the updated Results. Expand Amplifier & wiring to review the system requirements. Check weak listening positions and uniformity before preparing the report.
Keep in mind
Calculated coverage is a design estimate. Confirm the installed system with measurements during commissioning.
Lesson 02 · 11:09Speakers, coverage and the 3D review
The whole lessontargets and count
A target per area, and the count to reach it.
Set the target first. Each area has its own target SPL, pre-filled by a venue preset and still yours to change. With speakers placed, the card shows the continuous level, the peak capability and the headroom against the target: green is comfortable, amber is tight, red is underpowered.
The Coverage Advisor sizes the count from the area, the coverage of the model at the mount actually used, and the target. It shows the grid, such as 3 × 2, and whether you have placed enough. Apply layout places that grid and Optimize spacing evens it out. Coverage counts to each speaker’s real −6 dB edge at its throw distance.
Density sets the spacing. Even places speakers edge to edge, where the −6 dB circles just touch, for speech-grade coverage. Economy stretches the spacing by about 40%, accepted practice for background music, for the fewest speakers that still cover the area. Speakers are never packed closer than about 2 m.
A scene chip flips an area between its full design level and an ambient level about 12 dB lower, so a sports bar can be checked for a packed night and a quiet afternoon without moving a speaker.
| Venue | Target | RT60 | Noise | Spacing |
|---|---|---|---|---|
| Living room | 82 dB | 0.5 s | 35 dBA | Even |
| Dining room | 80 dB | 0.5 s | 40 dBA | Even |
| Bedroom | 78 dB | 0.4 s | 30 dBA | Economy |
| Kitchen | 84 dB | 0.6 s | 50 dBA | Even |
| Bathroom | 80 dB | 0.7 s | 40 dBA | Economy |
| Play room | 84 dB | 0.5 s | 45 dBA | Even |
| Meeting room | 76 dB | 0.6 s | 42 dBA | Even |
| Coffee shop | 85 dB | 0.6 s | 62 dBA | Even |
| Restaurant | 88 dB | 0.7 s | 68 dBA | Even |
| Sports bar | 92 dB | 0.8 s | 74 dBA | Even |
| Gym and fitness | 98 dB | 1.2 s | 78 dBA | Even |
| Small club | 102 dB | 0.9 s | 80 dBA | Even |
| Outdoor patio | 88 dB | Open air | 60 dBA | Economy |
| Garden | 88 dB | Open air | 55 dBA | Even |
tuning
Tuned to the target, or at full output.
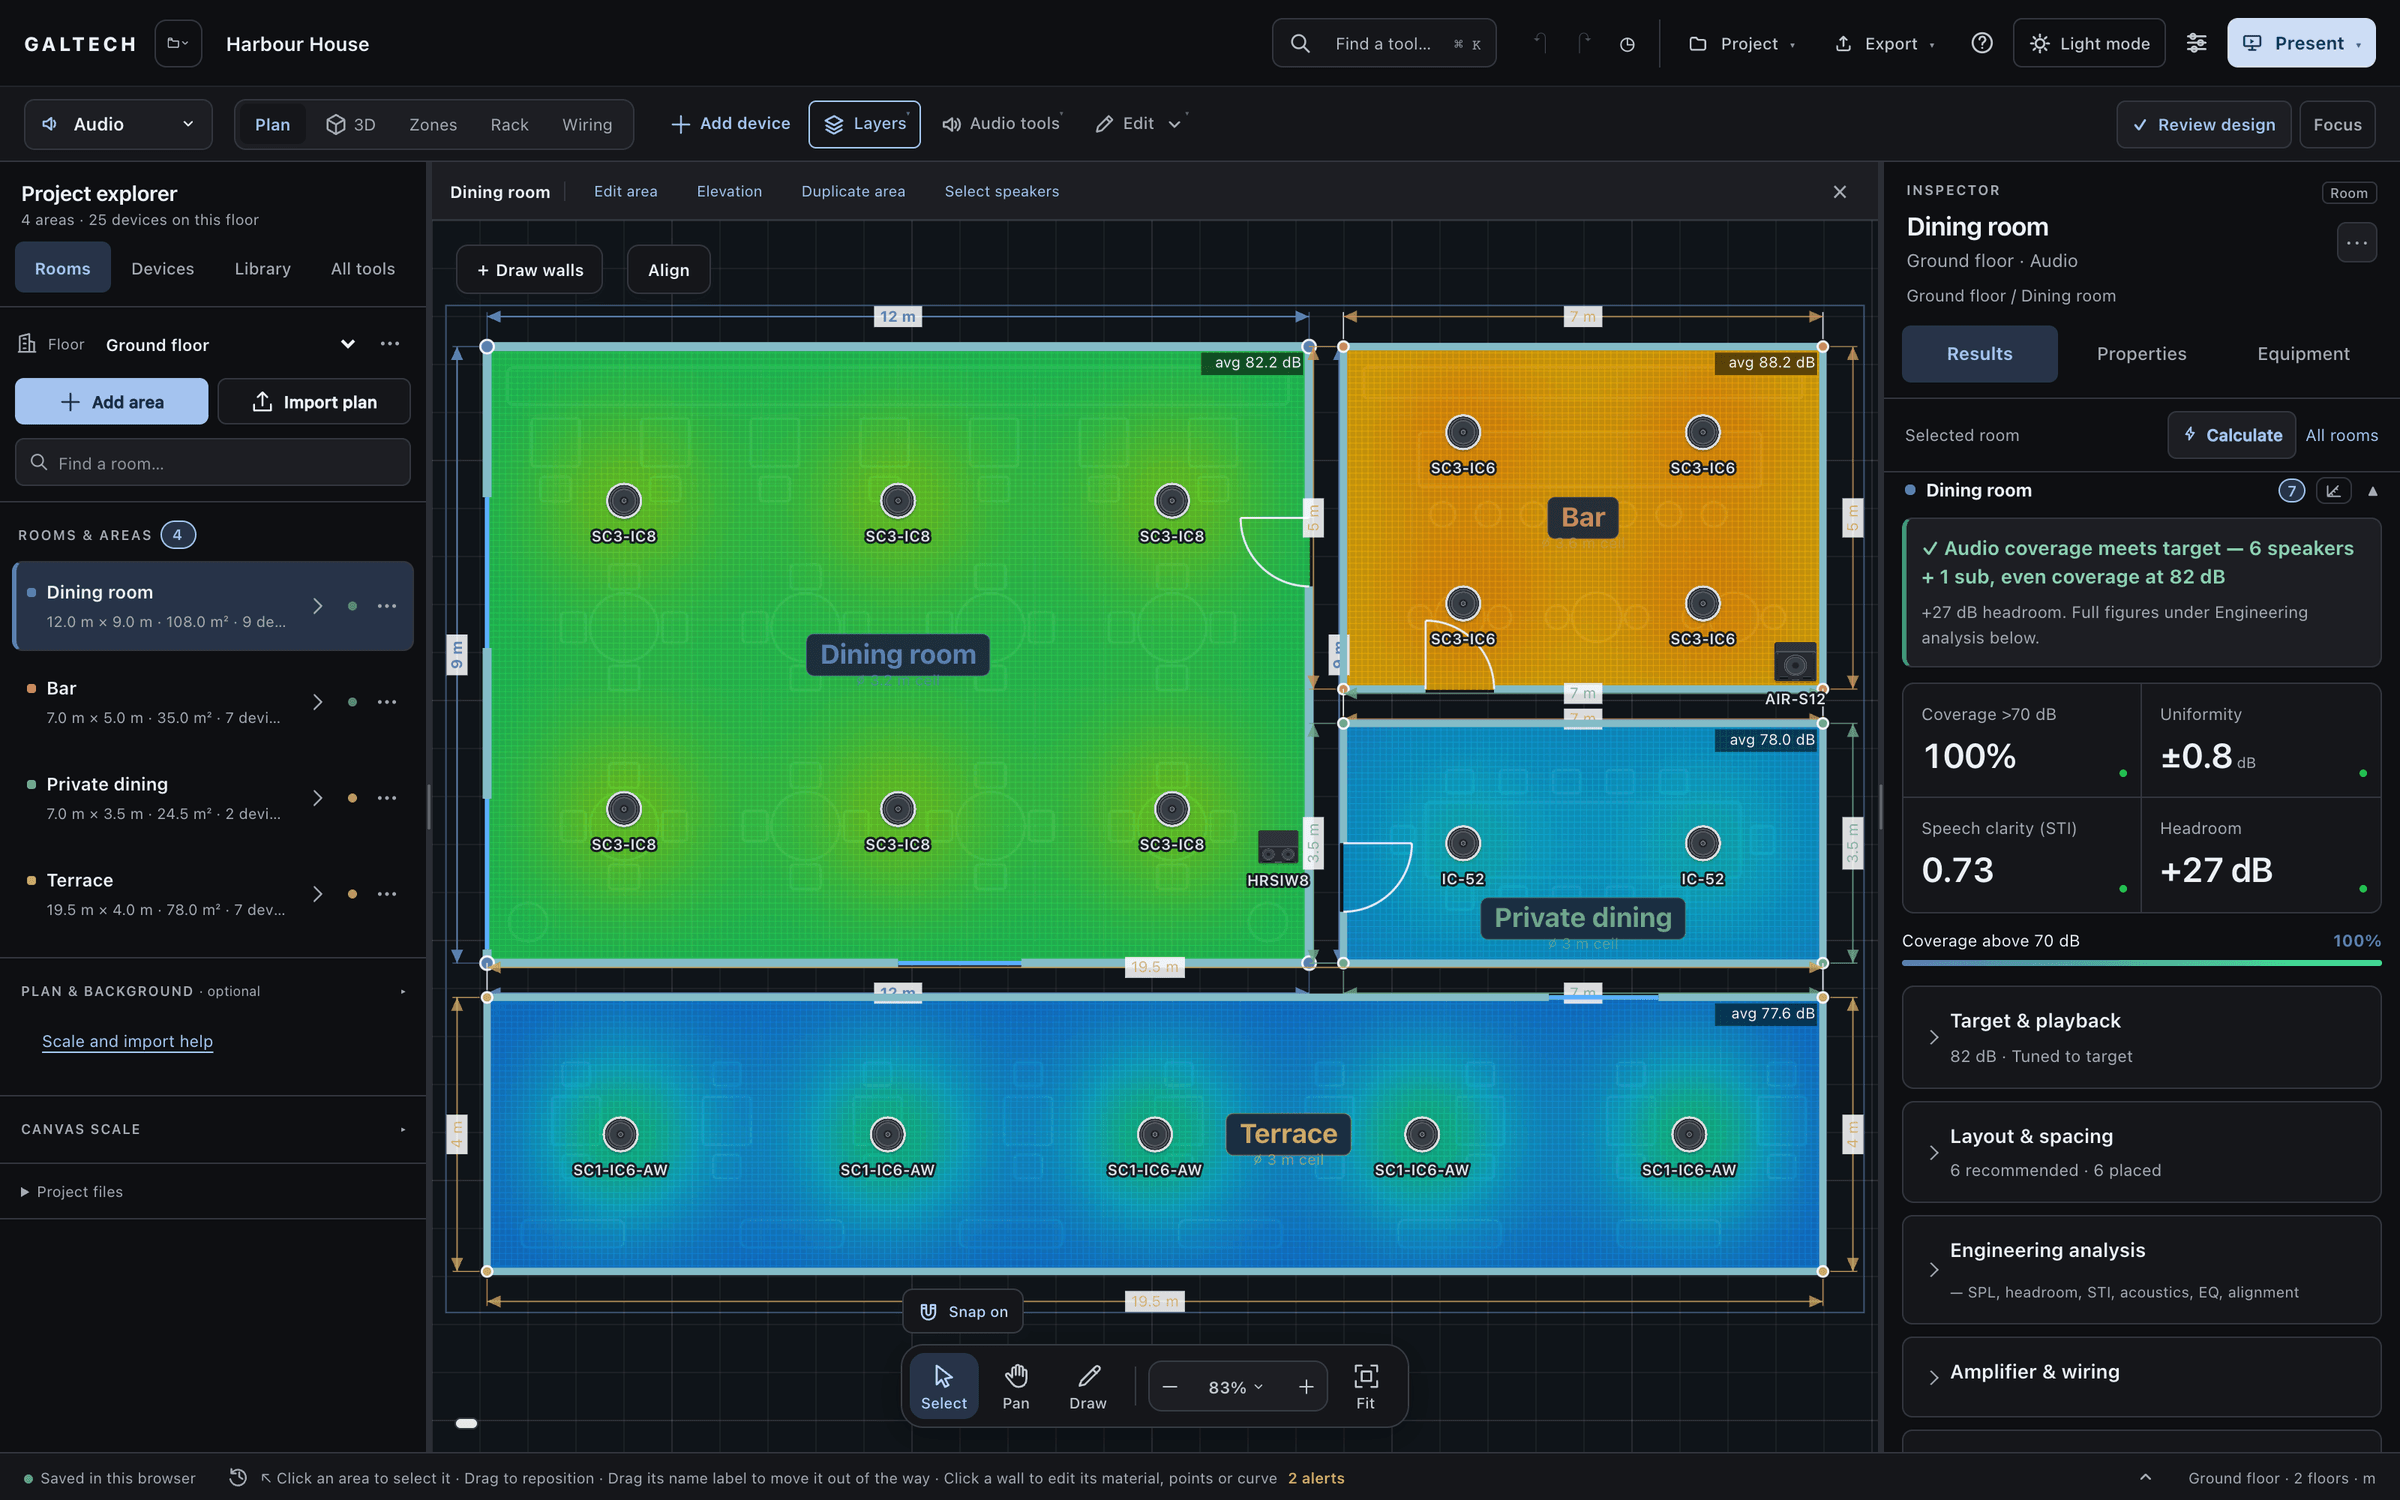
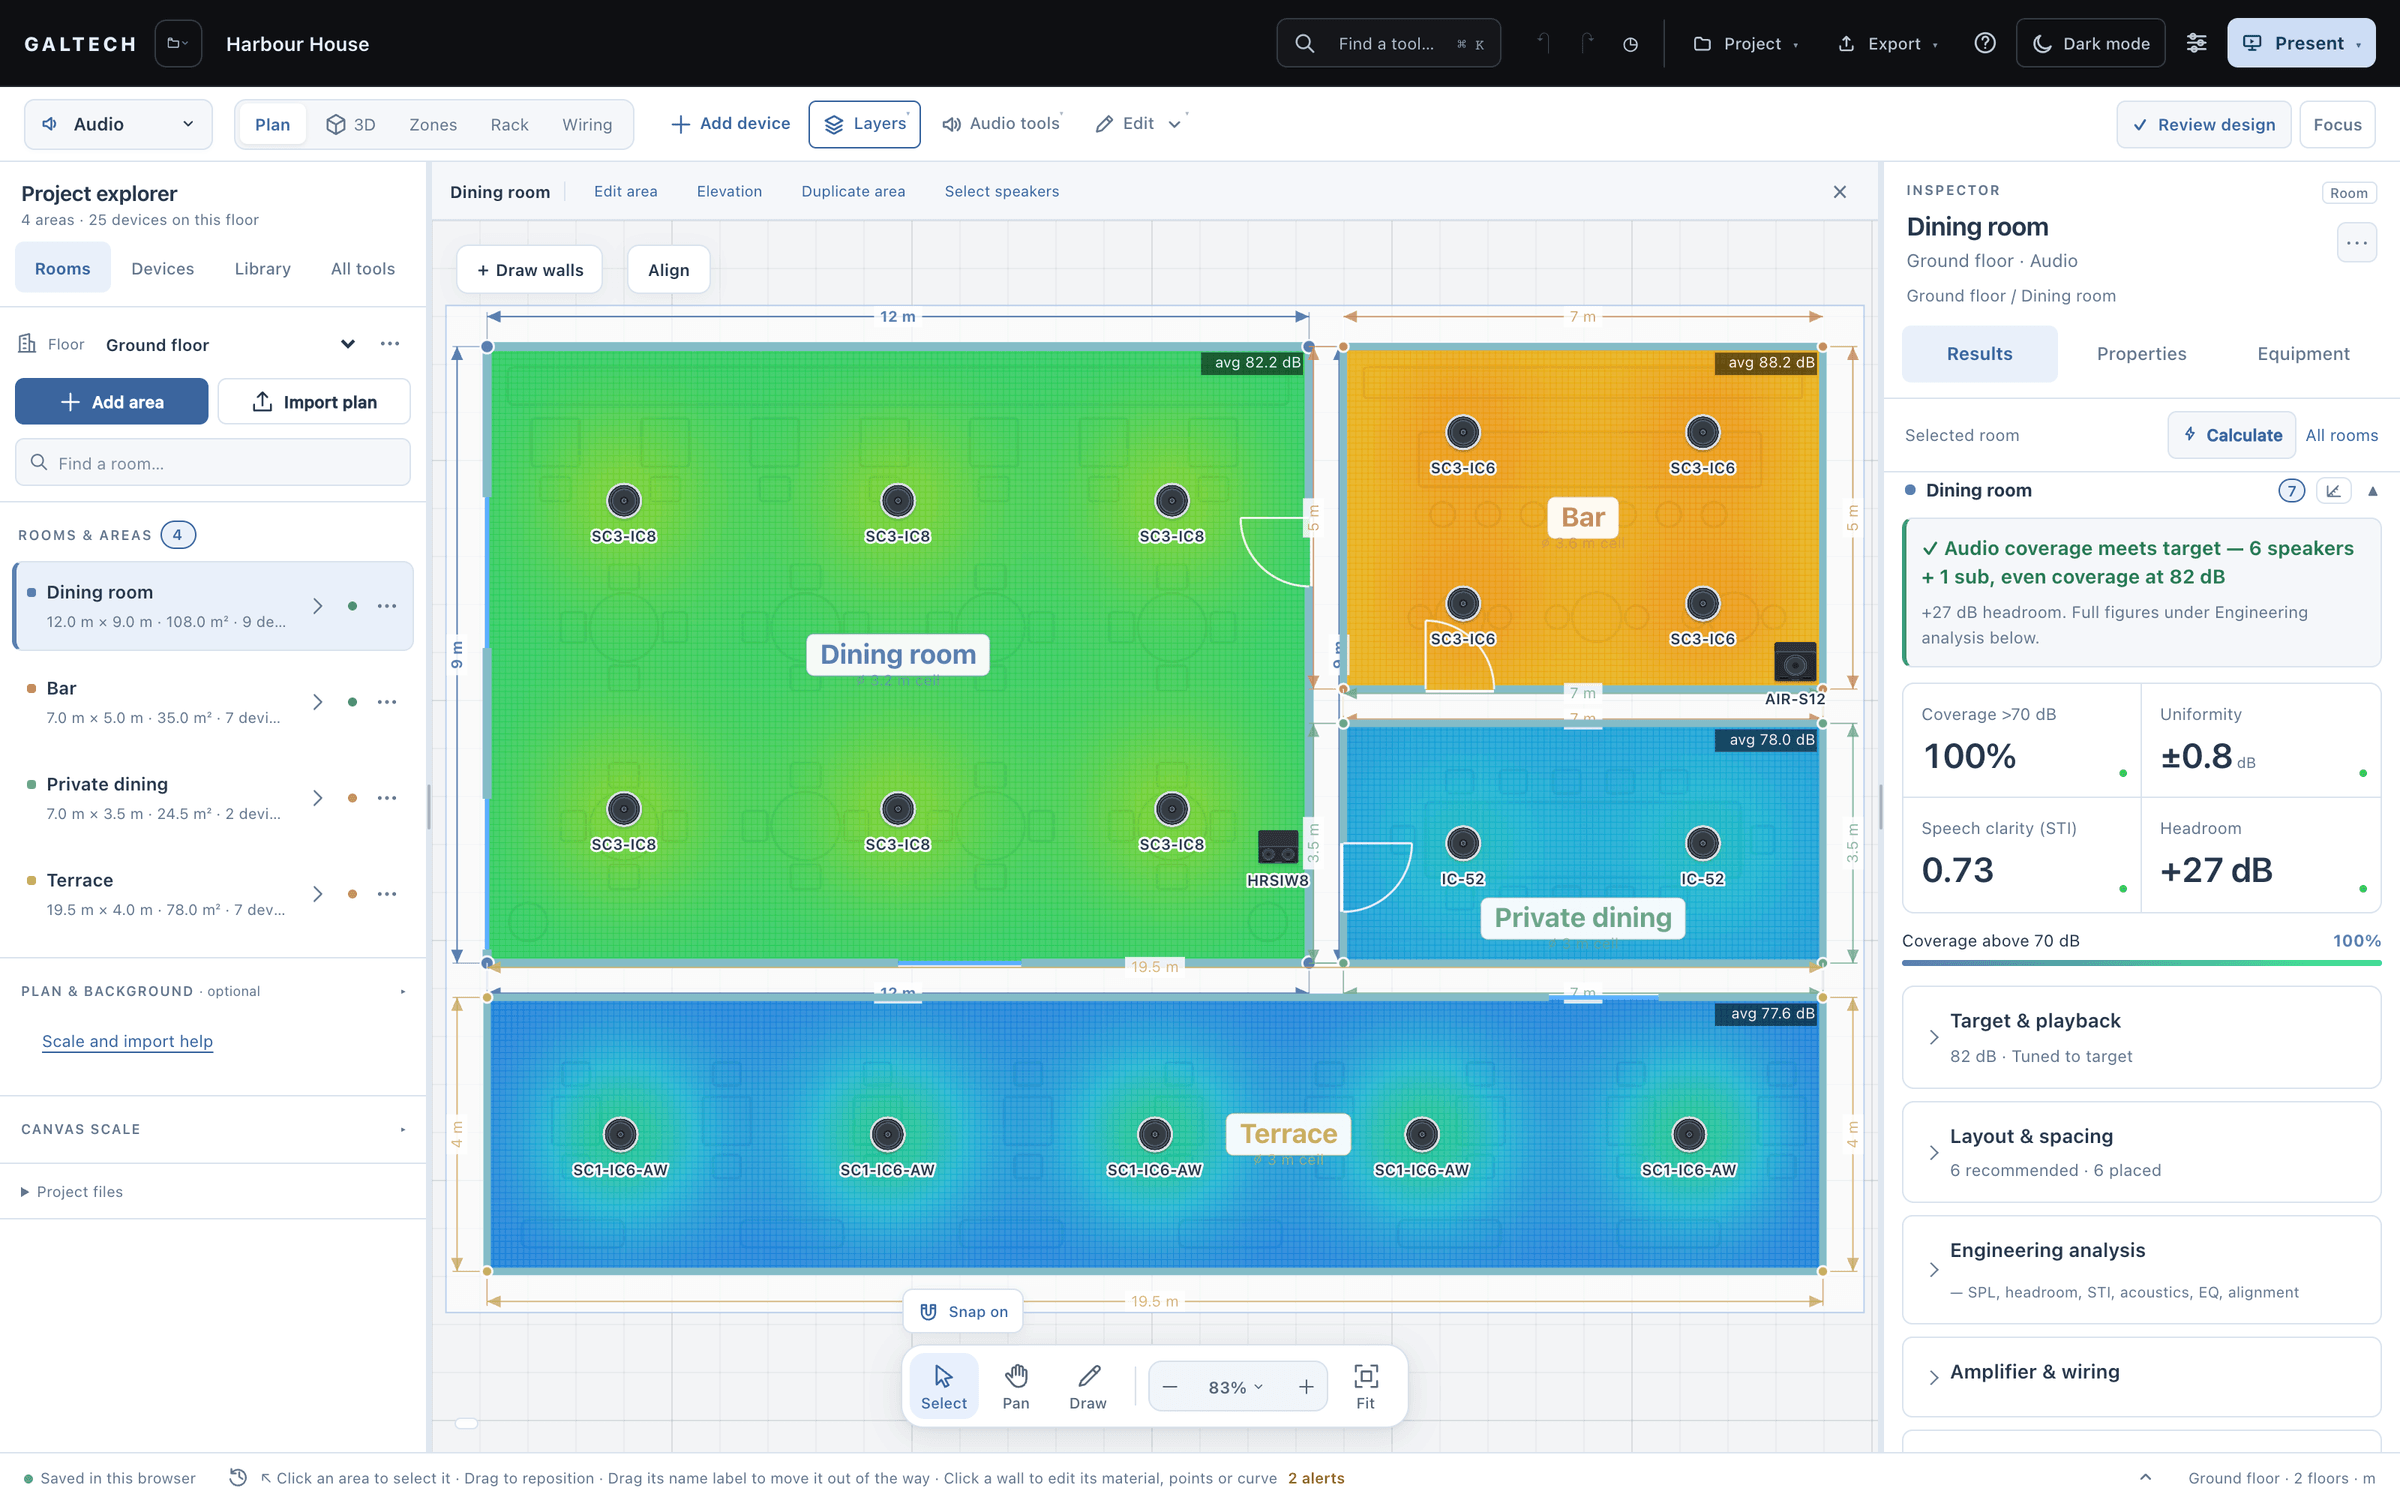
By default the heatmap shows a commissioned install: every speaker is level-matched to the area’s target, as you would set the gains on site, so no model reads hotter just because it is louder. A speaker that cannot reach the target stays at its maximum, so a real gap still shows.
Turn tuning off to see every speaker at full rated power and check how loud the system can go. The setting is per area: one project can have the restaurant tuned to target while a demo area runs flat out.
Focus pins, or a standing or seated person, mark where the sound must be at its best: the bar, a stage, a VIP table. Tuned levels land the target at the pins, and with no pins the centre of the room is the reference.
Layers, Colourblind-safe colours switches every heatmap, SPL, Wi-Fi and CCTV alike, to a perceptually even ramp that stays legible for the common types of colour vision.
accuracy
A planning baseline, not a guarantee.
The engine is a point-source and diffuse-field predictor. For average level, coverage and the relative decisions (how many speakers, how far apart, whether the amplifier has headroom) expect agreement within about ±2 to 3 dB of a careful meter reading at mid and high frequencies.
Single points, steep off-axis angles and overlap zones can vary by ±3 to 6 dB, and bass below the room’s modal region in a small room is approximate. Use honest datasheet figures, a realistic RT60, the right ceiling and ear heights and the venue’s noise floor for the best result.
Commission with an SPL meter. Site calibration then trims the model to the measured average, so the handover shows the room as built.
in figures
The figures behind the colours.
The demo figures are the Harbour House dining room. A real project gets its own.
- default colour scale
- 80 to 110 dB
- dining room average (demo)
- 82.2 dB
- uniformity (demo)
- ±0.8 dB
- typical agreement with a careful meter, mid and high frequencies
- ±2 to 3 dB
| Level | Minimum, maximum and average, in dB SPL |
|---|---|
| Uniformity | The spread in ± dB; smaller is more even |
| Coverage | The share of the area above the coverage level |
| Headroom | Continuous level and peak capability against the target |
| STI | Speech intelligibility against the 0.60 target |
| Advisor | The recommended count and grid for the model in use |
questions
Questions, answered plainly.
Why does adding a subwoofer not raise the area’s level?
A subwoofer plays below about 150 Hz, so the broadband figures (the heatmap, the average, headroom, coverage and uniformity) are the mains’. The sub shows where it plays: the 63 and 125 Hz bands, the low-frequency extension row and its level against the mains.
Which scale should I use to judge coverage?
Narrow the scale around the target to see small differences, and widen it for the overall picture. The legend always shows the range in use. For layout decisions leave Interference off; switch it on to inspect overlap between neighbouring speakers.
How close is the heatmap to a measurement?
For average level and coverage, expect about ±2 to 3 dB of a careful meter reading at mid and high frequencies. It is a planning baseline, not a guarantee: commission with an SPL meter and calibrate the model to what you measure.
Prediction accuracy in the docs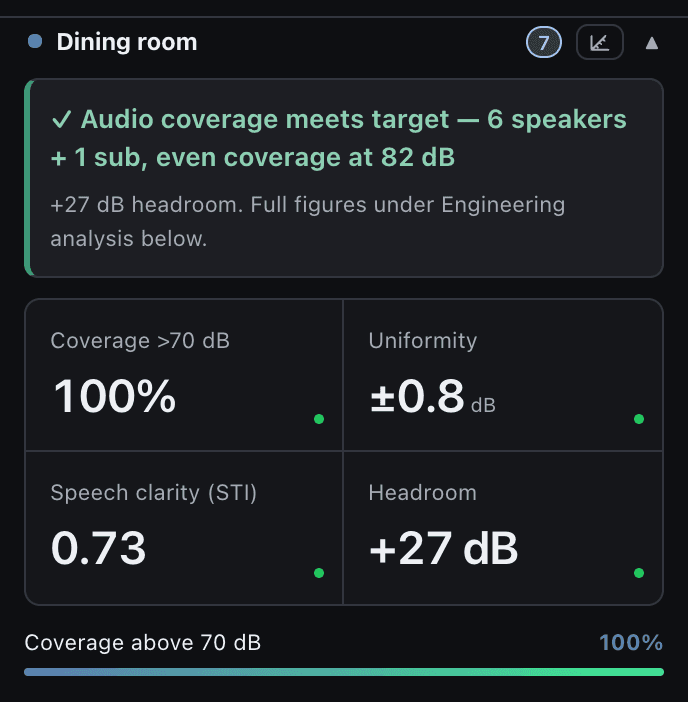
Ready when the client is.
Draw it, check it, show it, price it and hand it over, from one project.
15-day trial for approved companies. No card, nothing to cancel.