On this page
The heatmap is the first thing a client looks at and the easiest picture in the tool to misread. Its colours mean exactly what the scale beside them says, and nothing more. Here is how to read one properly, from the decibels underneath to the numbers that should decide whether a design is ready.
Decibels in two minutes
Sound pressure level (SPL) is measured in decibels against a reference of 20 micropascals, roughly the quietest sound a young ear can hear at 1 kHz. The scale is logarithmic, so a few rules of thumb carry most of the weight:
| Change | What it means |
|---|---|
| +3 dB | Twice the acoustic power: two equal speakers instead of one |
| +6 dB | Twice the sound pressure. Also what a small speaker loses for each doubling of distance in open air |
| +10 dB | Ten times the power. It sounds roughly twice as loud |
A difference of 1 dB is hard to hear in a real room; 3 dB is noticeable. The heatmap shows the predicted level across the listening plane, the height of the listeners’ ears that you set for each area, so a seated restaurant and a standing bar are both judged where the people are.
Two more units appear beside the map. The area card gives an A-weighted total in dBA, which follows how loud the sound seems, and the level in eight octave bands from 63 Hz to 8 kHz. The noise floor you type for an area is in dBA too.
The colour scale
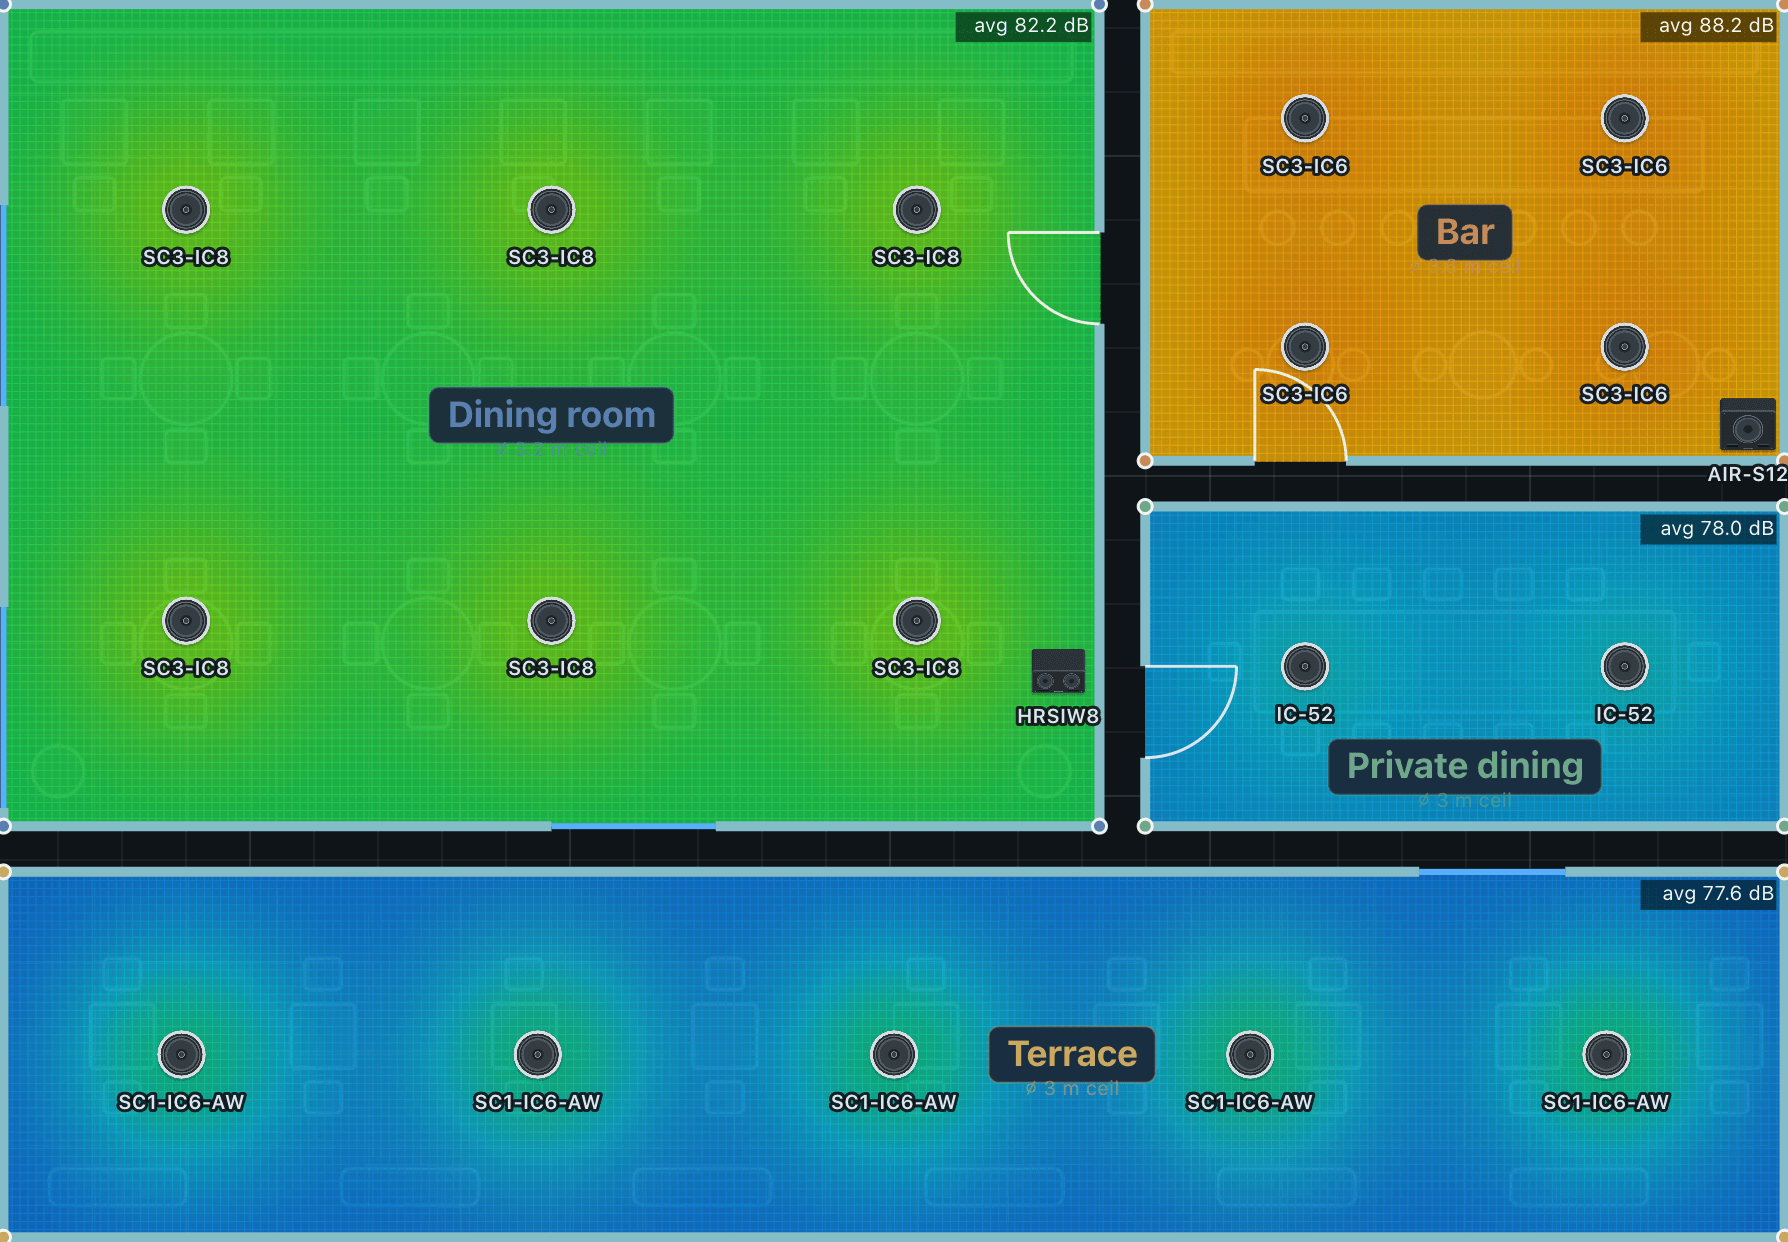
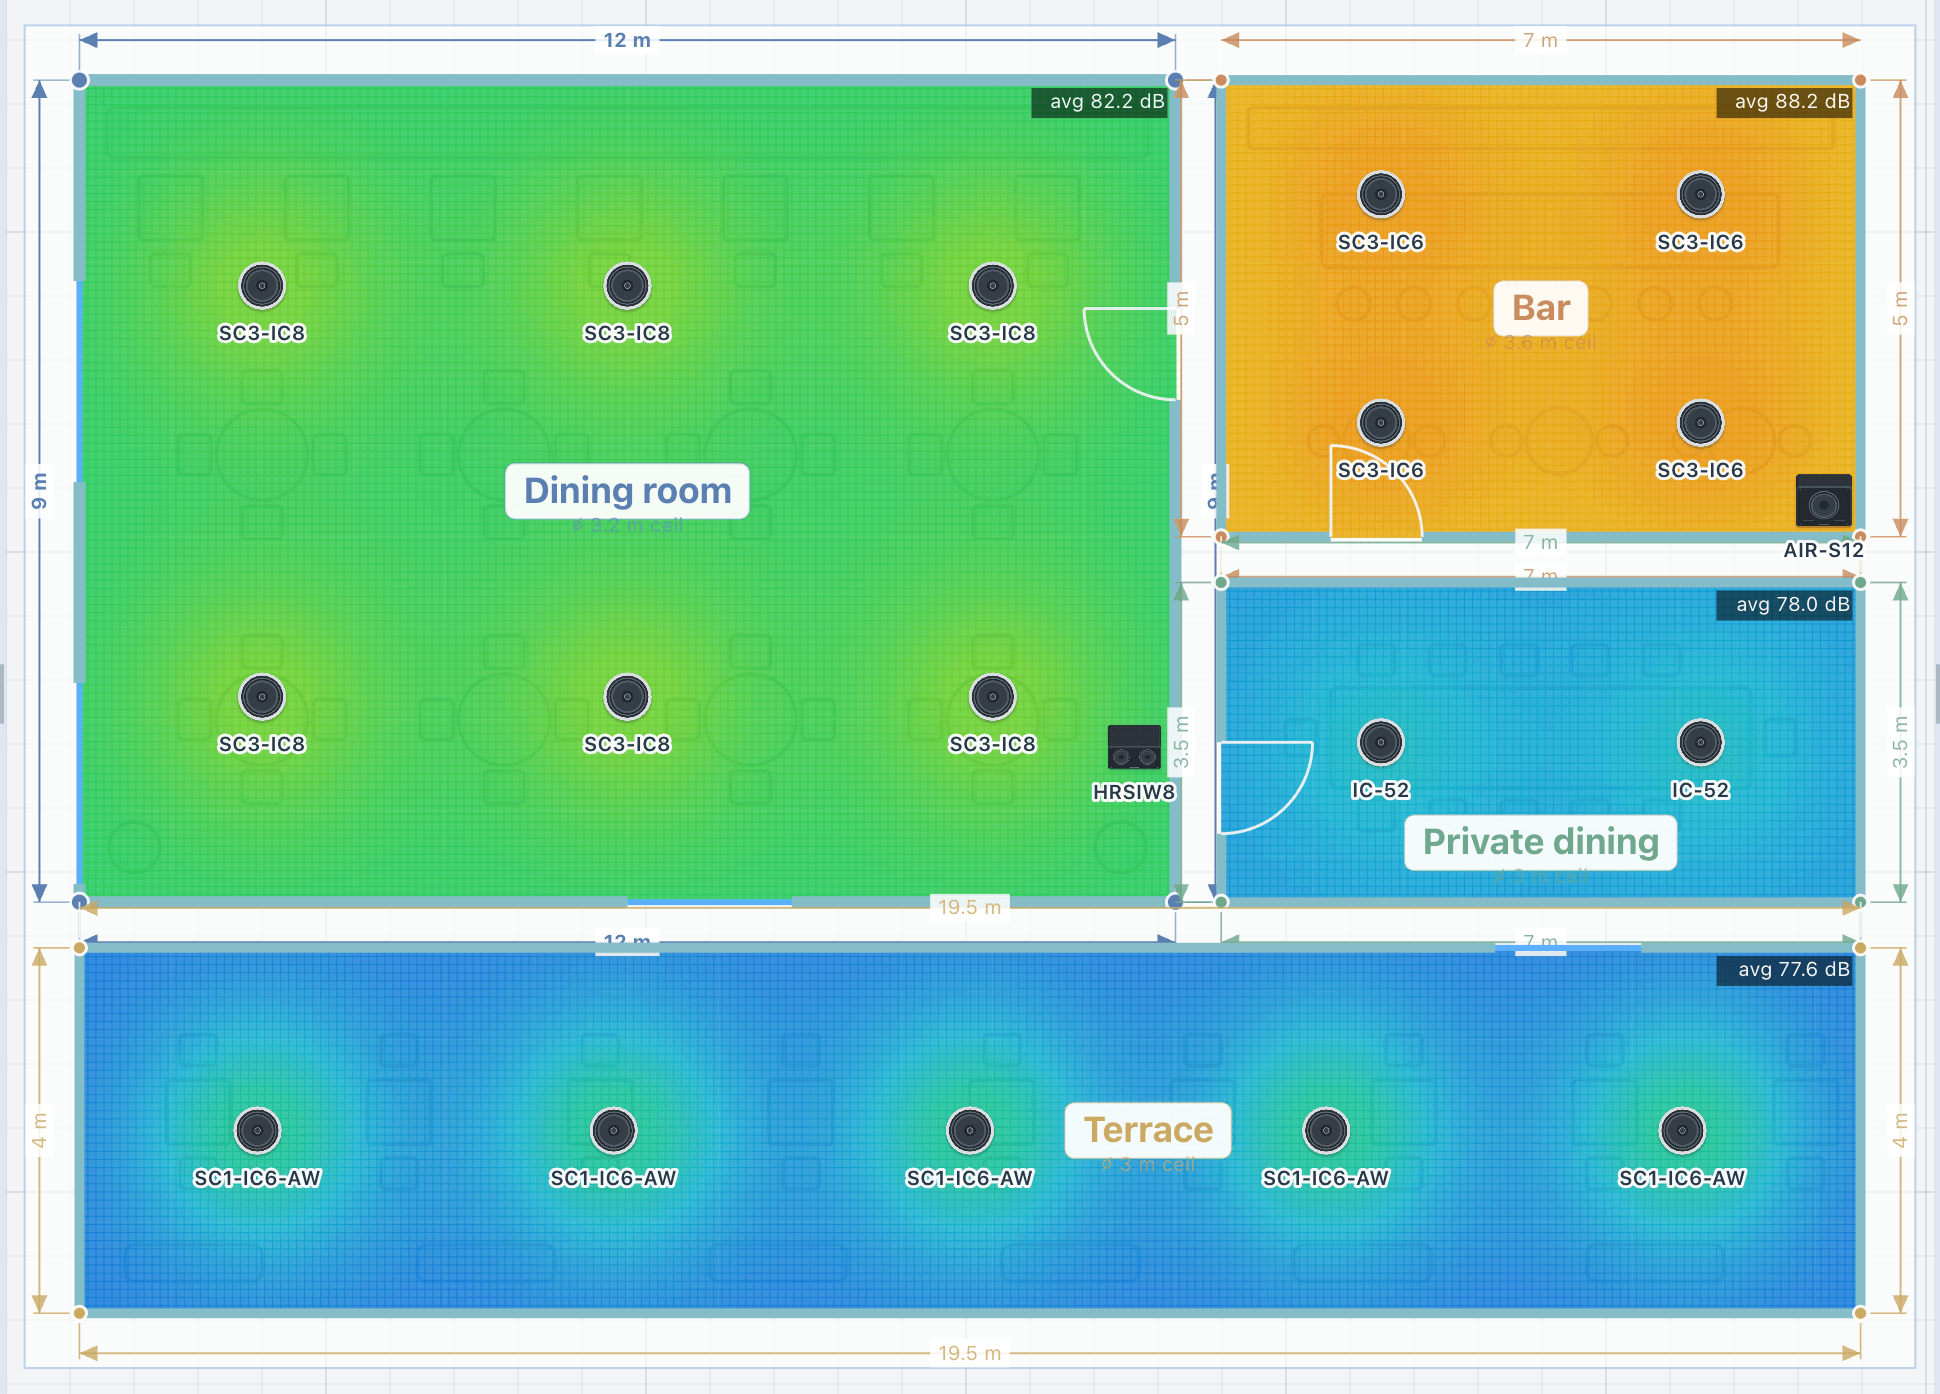
Each colour stands for a level between the scale’s minimum and maximum. Warm colours are loud and cool colours are quiet, like a weather map. You set the range in the toolbar, and the legend always shows the one in use. Read the legend before the colours, because the same design can look calm or alarming depending on the scale:
A wide scale, 60 to 100 dB
A narrow scale, 78 to 86 dB
- Narrow the range, to 78 to 86 dB for example, to see a difference of 2 dB clearly.
- Widen it for an overall picture of a floor.
- For colour-blind viewers, Layers has a colour-blind-safe ramp, violet through teal to yellow, for every heatmap in the tool.
What good coverage looks like
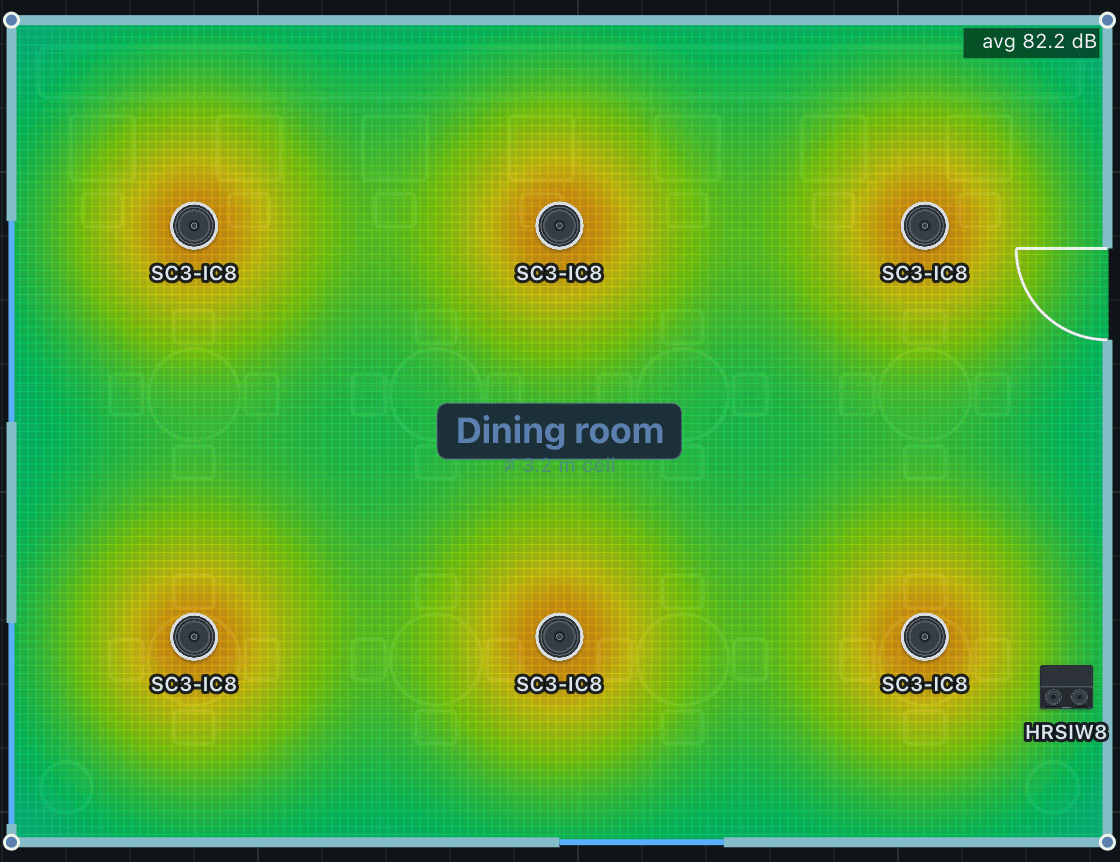
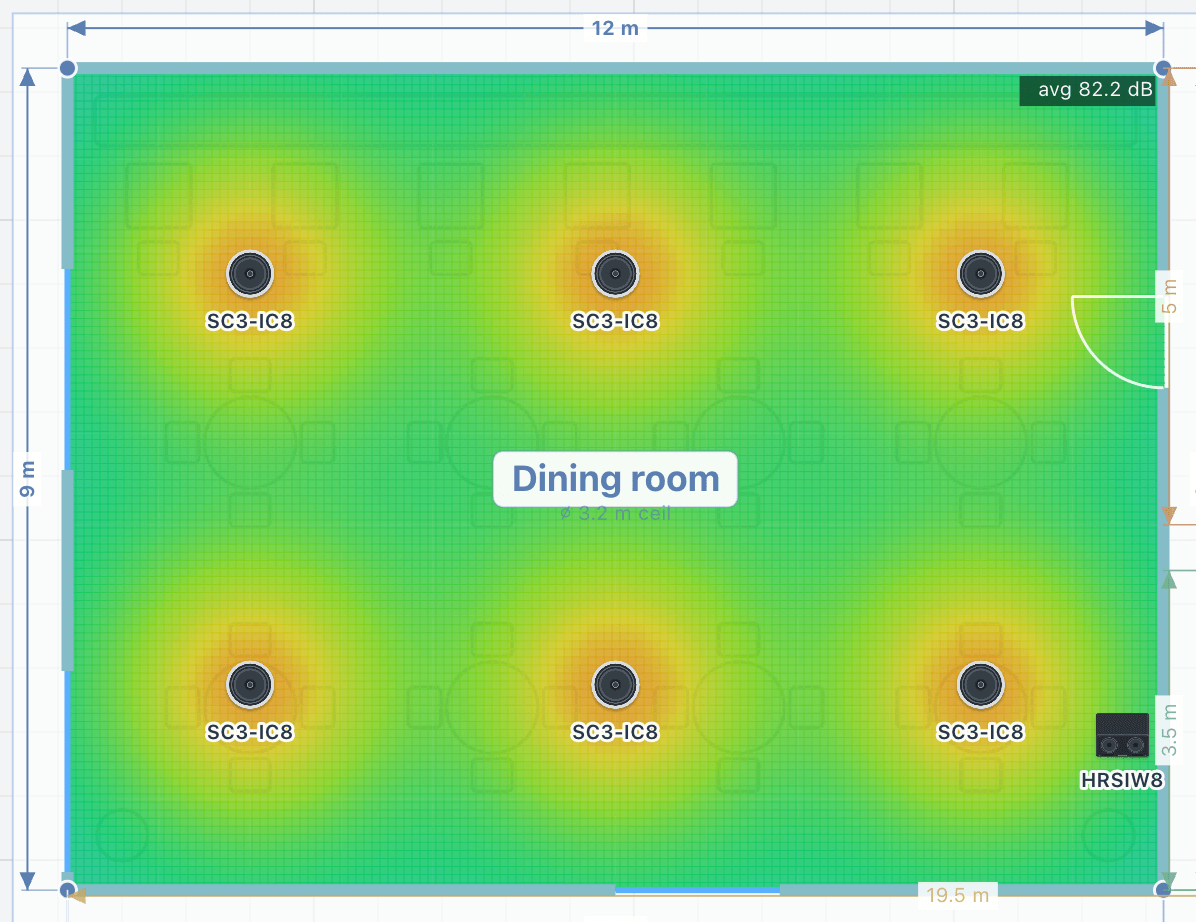
Read the map over the places people actually sit or stand, not over the whole outline. Good coverage is a calm field of one or two neighbouring colours over the listening area, with no large cool patches where people will be, no tight hot spots under each speaker, and a level close to the target you set for the area.
The colours are a picture of numbers the results card gives you directly, and the tool’s standards check grades them:
| Check | Passes at |
|---|---|
| Coverage uniformity | Within 6 dB (±3 dB) across the middle 90% of the area |
| Area above 70 dB | At least 90% of the area |
| Continuous level against the target | Holds the target with every speaker at full drive |
| Headroom | At least 6 dB above the target, for peaks |
Uniformity is measured over the middle 90% of the area so that a single corner cell cannot spoil the figure. A spread of up to 9 dB is marginal; more than that fails.
The −6 dB edge
Switch on Coverage and each speaker draws its own cone, red on axis and green at its useful edge. That edge is the −6 dB point: where the speaker’s level has fallen 6 dB below its level on axis.
A datasheet’s coverage angle is defined the same way, by the angle off axis where the level drops 6 dB, at a stated frequency. On the floor, though, the edge of a cone is further from the speaker than the point straight below it, so it also loses level to distance. The tool measures each speaker’s coverage to its real −6 dB edge at its throw distance rather than to a geometric cone.
Use the cones to aim one speaker. Use the heatmap to judge the area, because it adds every speaker up at once.
Tuned or flat out
The heatmap normally shows a commissioned system: every speaker turned down to the area’s target, as you would set the gains on site. A speaker that cannot reach the target stays at its maximum, so a real gap still shows. Turn tuned levels off to see every speaker at its full rated output, which tells you how loud the system can go rather than how it will be set.
Each area also has a scene chip that drops the level by about 12 dB to an ambient setting, so you can check a café or a sports bar at its quiet hours as well as its busy ones.
What the heatmap is not
- It is a prediction at ear height: a planning baseline, not a measurement.
- It adds speakers up as energy by default. The Interference layer adds them as waves instead, and shows the comb-filter ripple you would measure where coverage overlaps.
- The direct-to-reverberant view relates to clarity, not loudness.
- Bass below the room’s modal region is approximate in any model of this kind.
For average level and coverage, expect agreement within about 2 to 3 dB of a careful meter reading at mid and high frequencies. Single points and overlap zones can differ by 3 to 6 dB. After installation, site calibration trims the model to your measured average, so the handover documents describe the room as built.
A reading order
- Read the legend: what range are these colours?
- Check the area’s target, and the listeners or focus pins it is tuned to.
- Look over the listening area for cool gaps and hot spots.
- Read the uniformity, the minimum and the area above 70 dB.
- Check the continuous level and the headroom against the target.
- Open the area in 3D and walk it before anyone else does.
Lesson 02 of the tutorials walks through the same reading on screen: its key moment “Reading the heatmap” starts 4:58 into the video.