On this page
Every area in the tool ends with a number between 0 and 1 beside the letters STI. In the Harbour House demo, the dining room reads 0.73 and the standards check marks it as a pass against 0.60. This article explains what that number measures, why 0.60 is the line the tool checks against, and what you can change when an area falls short.
What STI measures
Speech is a carrier whose loudness rises and falls a few times a second, syllable by syllable. Listeners follow those slow fluctuations as much as the sound itself. Anything that fills in the quiet moments between syllables makes speech harder to follow, even when it is perfectly loud.
The Speech Transmission Index (STI) measures how much of that rise and fall survives the trip from the talker, or the loudspeaker, to the listener. It runs from 0, where none of the pattern survives, to 1, where it arrives intact. The method is set out in IEC 60268-16. It looks at seven octave bands from 125 Hz to 8 kHz and fourteen modulation rates from 0.63 Hz to 12.5 Hz, then weights the bands by how much each one contributes to understanding speech.
On site, STI is measured with a test signal played through the system. STIPA, a shorter method from the same standard designed for public address systems, is the usual choice for commissioning.
The scale
STI values are usually described with five words:
| STI | Rating |
|---|---|
| 0.75 to 1.00 | Excellent |
| 0.60 to 0.75 | Good |
| 0.45 to 0.60 | Fair |
| 0.30 to 0.45 | Poor |
| Below 0.30 | Bad |
The tool labels its predictions the same way, with Poor covering everything below 0.45.
Why 0.60
0.60 is where the Good band begins. A design that clears it has room for what a prediction cannot see in advance: a fuller room, a noisier evening, a speaker aimed a few degrees off. A design that only just reaches Fair has no margin at all.
The tool’s standards check reads the predicted STI for each area. 0.60 or more is a pass, 0.45 to 0.60 is marginal, and below 0.45 is a fail. The same figure appears on the results card, in the standards check and in the PDF report, so the client and the installer see one number.
Life safety is a different job
Voice alarm and emergency announcement systems follow their own standards and local codes, which set their own minimums and the way they are measured. Use those for life safety. The 0.60 target is a design goal for clear speech in everyday use, and a prediction is not a measurement.
What moves STI
Reverberation
Sound that keeps bouncing around a room arrives late and fills the gaps between syllables. The longer the reverberation time (RT60), the more the fast fluctuations of speech are smeared. Hard rooms of glass, stone, plaster and tile are where STI is usually lost.
Background noise
Noise fills the same gaps from the other side. A busy restaurant at around 70 dBA scores lower than a quiet boardroom at around 45 dBA with the same speakers at the same level, because the speech has less to stand out against. The tool asks for each area’s noise floor and checks the signal against it: at least 15 dB above the ambient for speech and 25 dB for music.
Distance and direct sound
Listeners close to a speaker hear mostly direct sound, which keeps its modulation. Further away, the room’s reverberant field takes over. More speakers at a lower level each, closer to the people listening, usually beat fewer speakers turned up. Speakers aimed at the listening area rather than at walls and ceilings help for the same reason.
Level
Too quiet, and the noise wins. Too loud, and the ear itself starts to mask what it hears, which the standard accounts for. Turning a system up rarely rescues a reverberant room.
Late arrivals
In a distributed system, sound from distant speakers reaches a listener after the sound from the nearest one. Arrivals that lag far behind behave like echoes. Delaying the closer speakers so the arrivals line up at the listening position keeps them together, which is what Auto-align sets for each area in the tool.
The classic model
For a room where reverberation and noise are the whole story, the share of a modulation that survives can be written down. Houtgast and Steeneken, whose work the standard grew from, multiplied a reverberation term by a noise term:
In a room with an RT60 of 1 second and no noise, a slow fluctuation of 1 Hz keeps about 91% of its depth, while a fast one of 8 Hz keeps about 26%. The fast fluctuations carry consonants, which is why a reverberant room makes speech sound blurred rather than quiet. The full method in IEC 60268-16 adds the direct sound, the weight of each band and the masking of the ear itself, and the tool follows that method across all seven bands and fourteen rates.
How the tool checks it
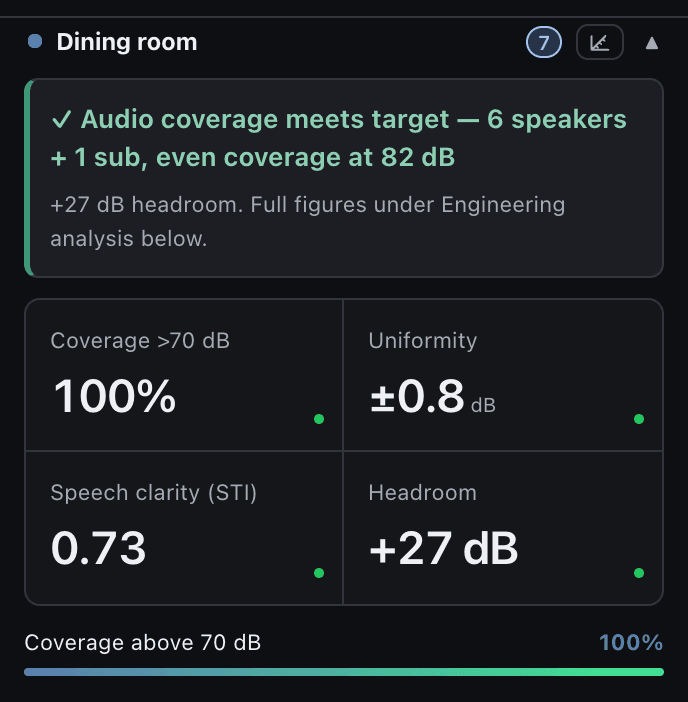
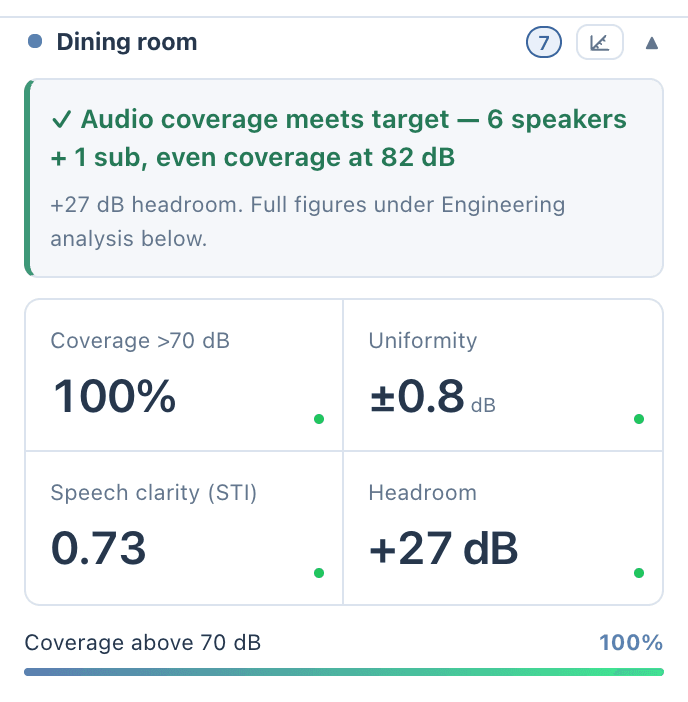
- Per area: STI on the results card and in the standards check, with the noise floor and the signal-to-noise margin beside it.
- Where the room is not a box: the Ray-Traced Check (beta) fires 24,000 rays per speaker through the real geometry and reports STI at each focus pin, or as a map across the floor. Use it for L-shaped rooms, high ceilings and big openings, where one figure for the whole room hides the worst seats.
- When the room is too lively: the treatment advisor says how many square metres of absorption to add, and what STI to expect afterwards.
- On site: site tracking records the measured STI of each area during installation, beside the design.
Prediction, then measurement
The prediction is a planning baseline, not a guarantee. Measure STI on site with a STIPA meter once the system is commissioned, in the conditions the space is used in, and record it against the design. If an area predicted at 0.62 measures 0.55 with the room full, the fix is usually one of the levers above: less reverberation, less noise, more speakers closer to the people, or better aim.