Audio
Frequency response, STI and the standards check
Read the analysis behind each verdict: octave bands, low-frequency extension, STI against its target, clarity, headroom, subwoofers and the standards check.
On this page
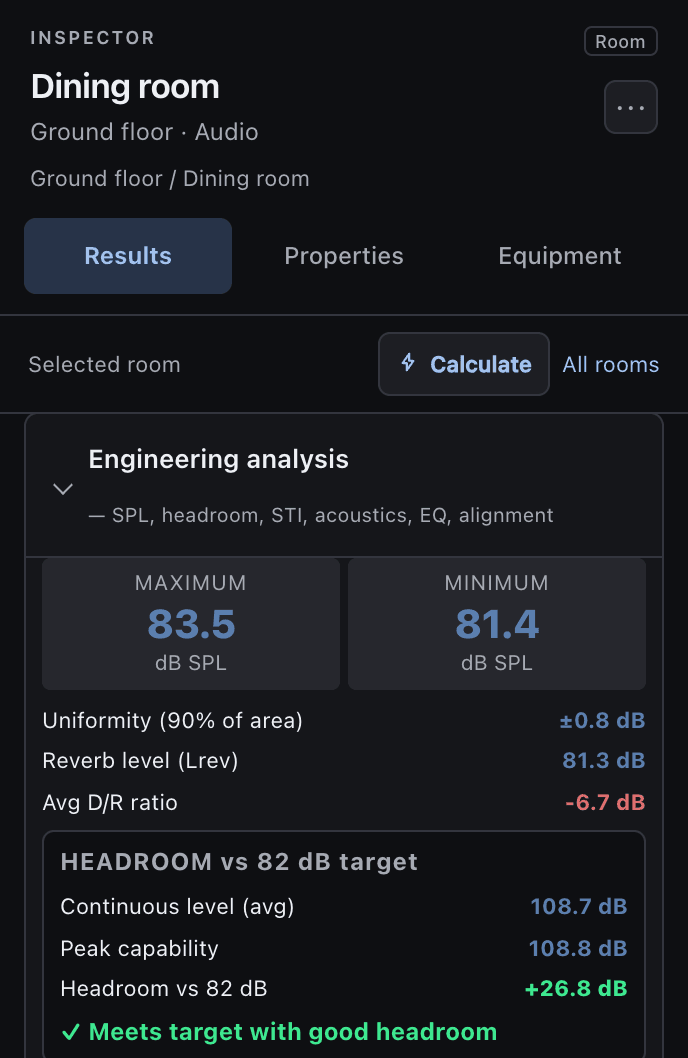
Behind each area’s verdict is the Engineering analysis, in the Inspector’s Results. It is the full picture, and it is what goes into the report. If a line is amber, the text beneath it says why, and usually what to change: do not skip it.
What the analysis lists
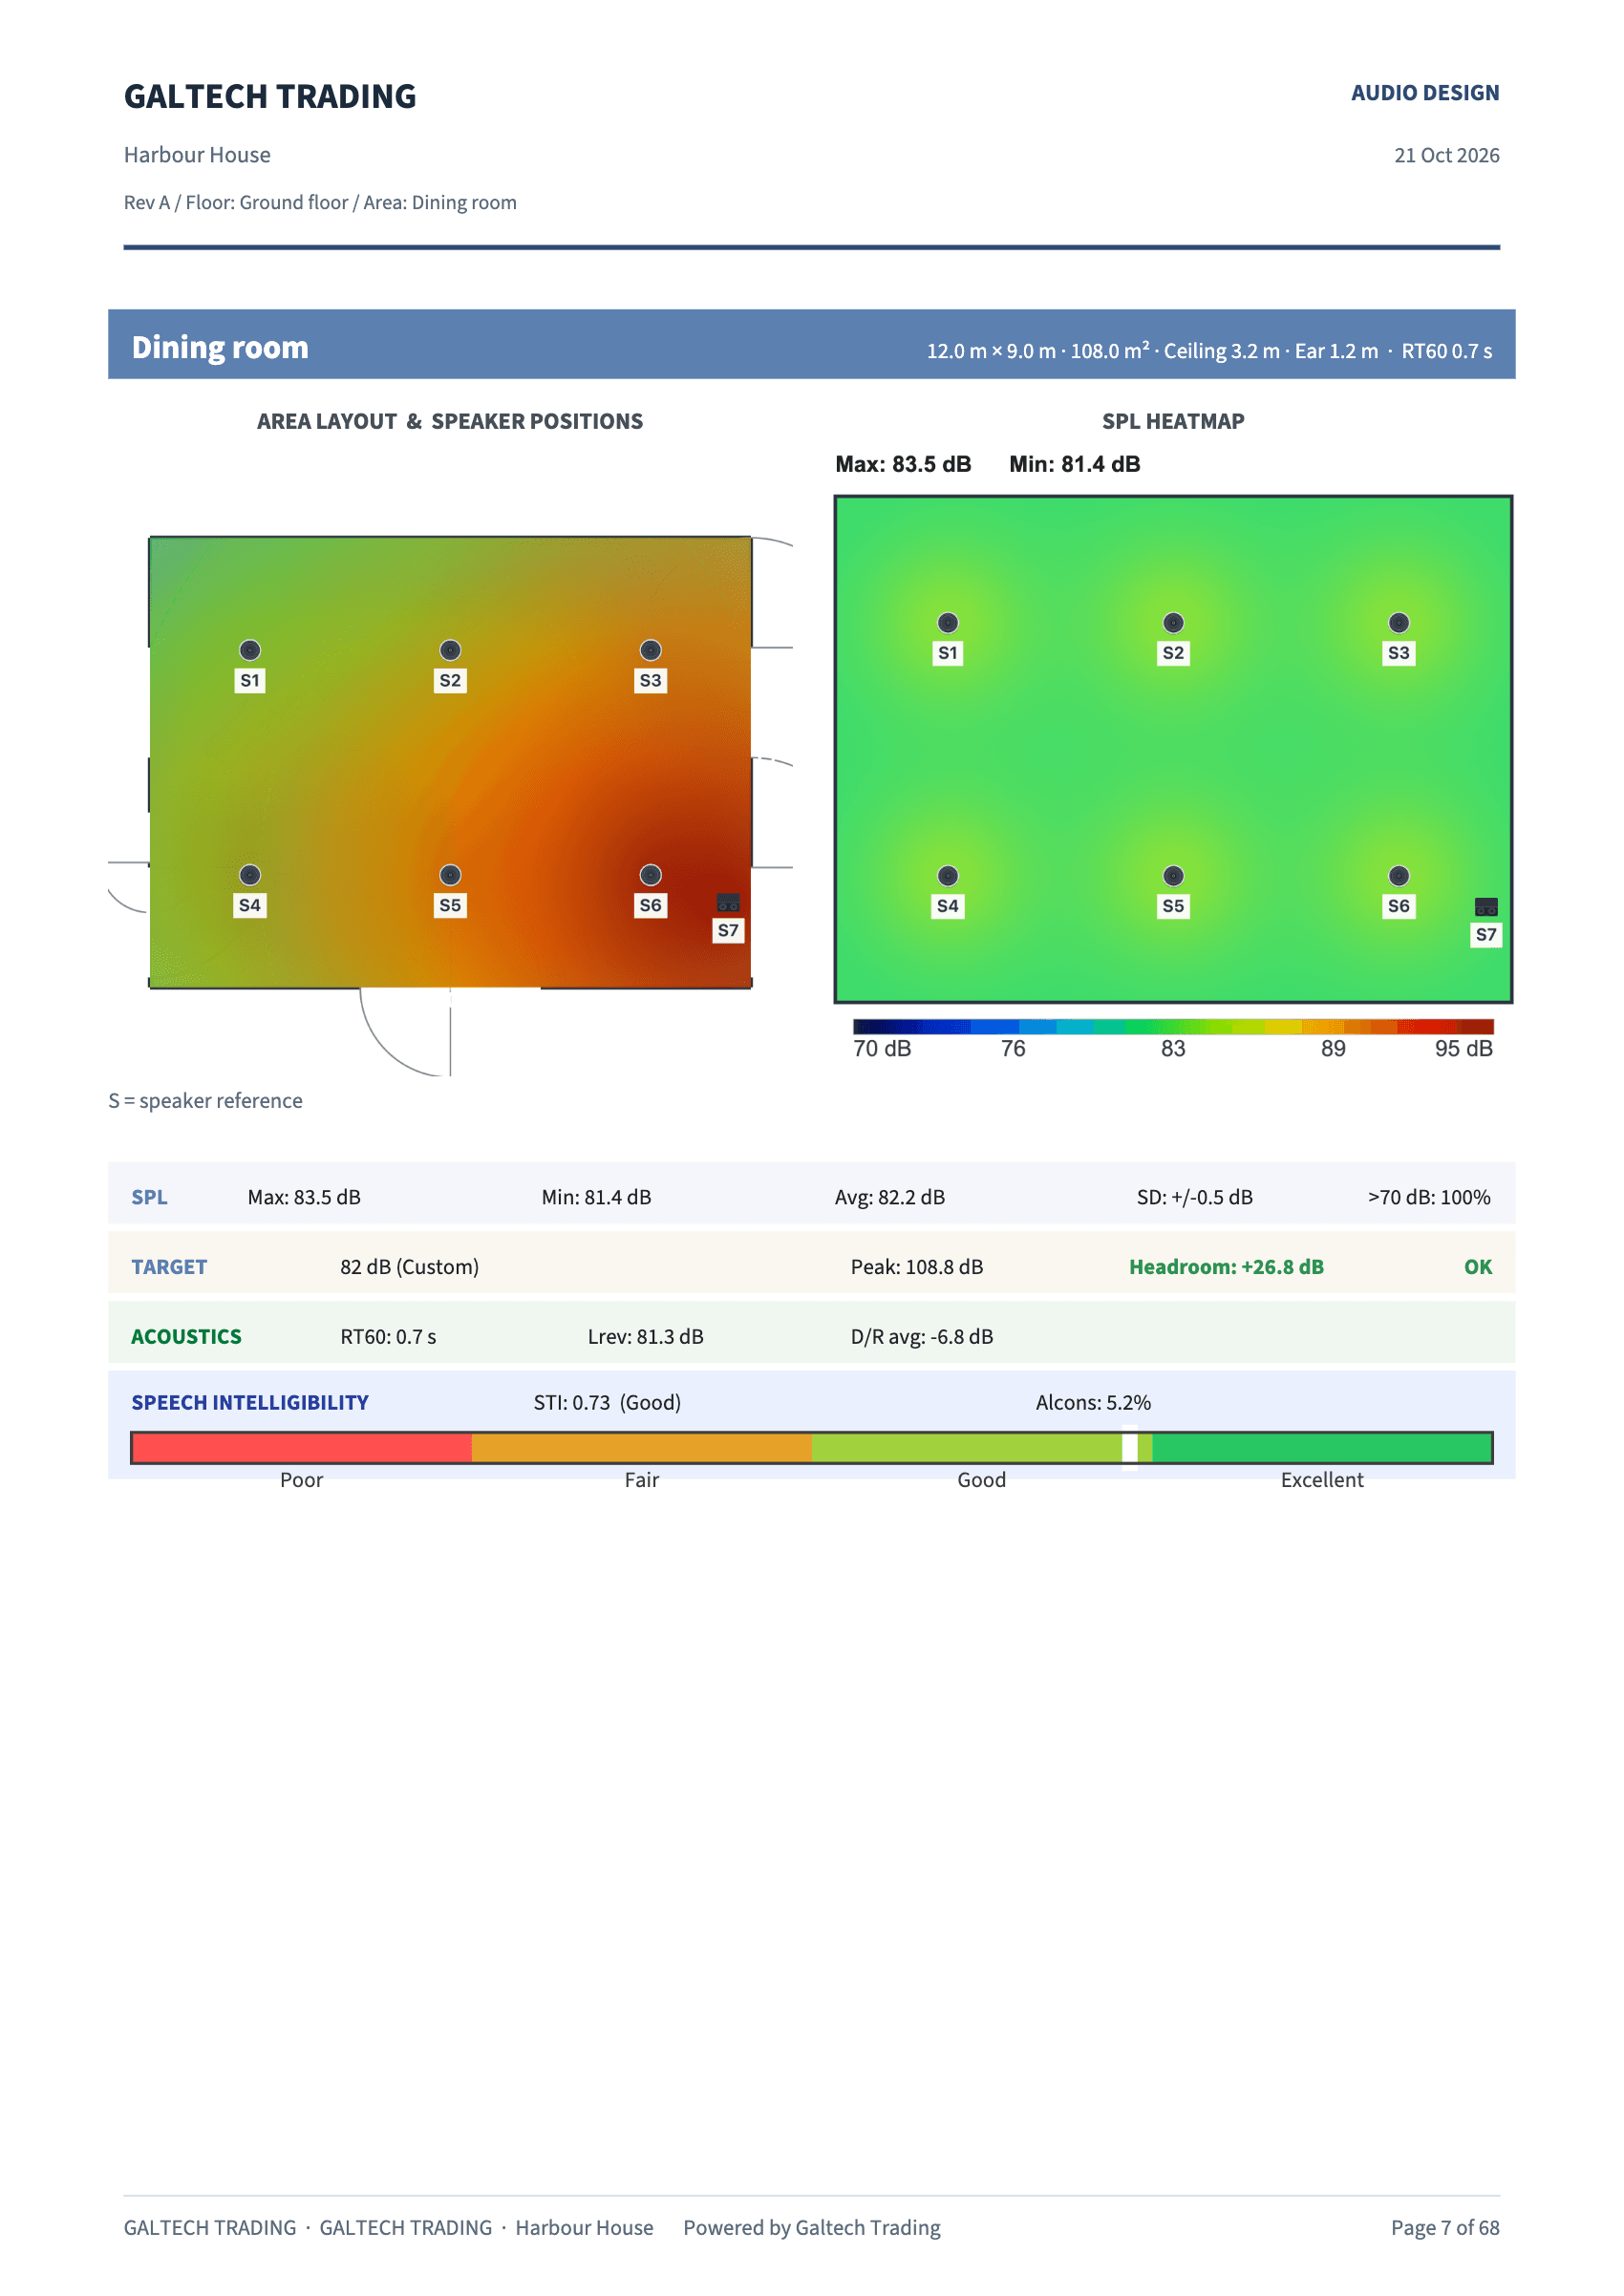
- The maximum and minimum level across the area, and the uniformity in decibels.
- The direct-to-reverberant ratio.
- Headroom: what the system can do against what you asked of it, continuous first and then peak.
- Speech intelligibility, the STI, scored from poor to excellent, with the room’s contribution shown separately.
- The octave-band response, the A-weighted level and the low-frequency extension.
- The standards check.
Octave-band response
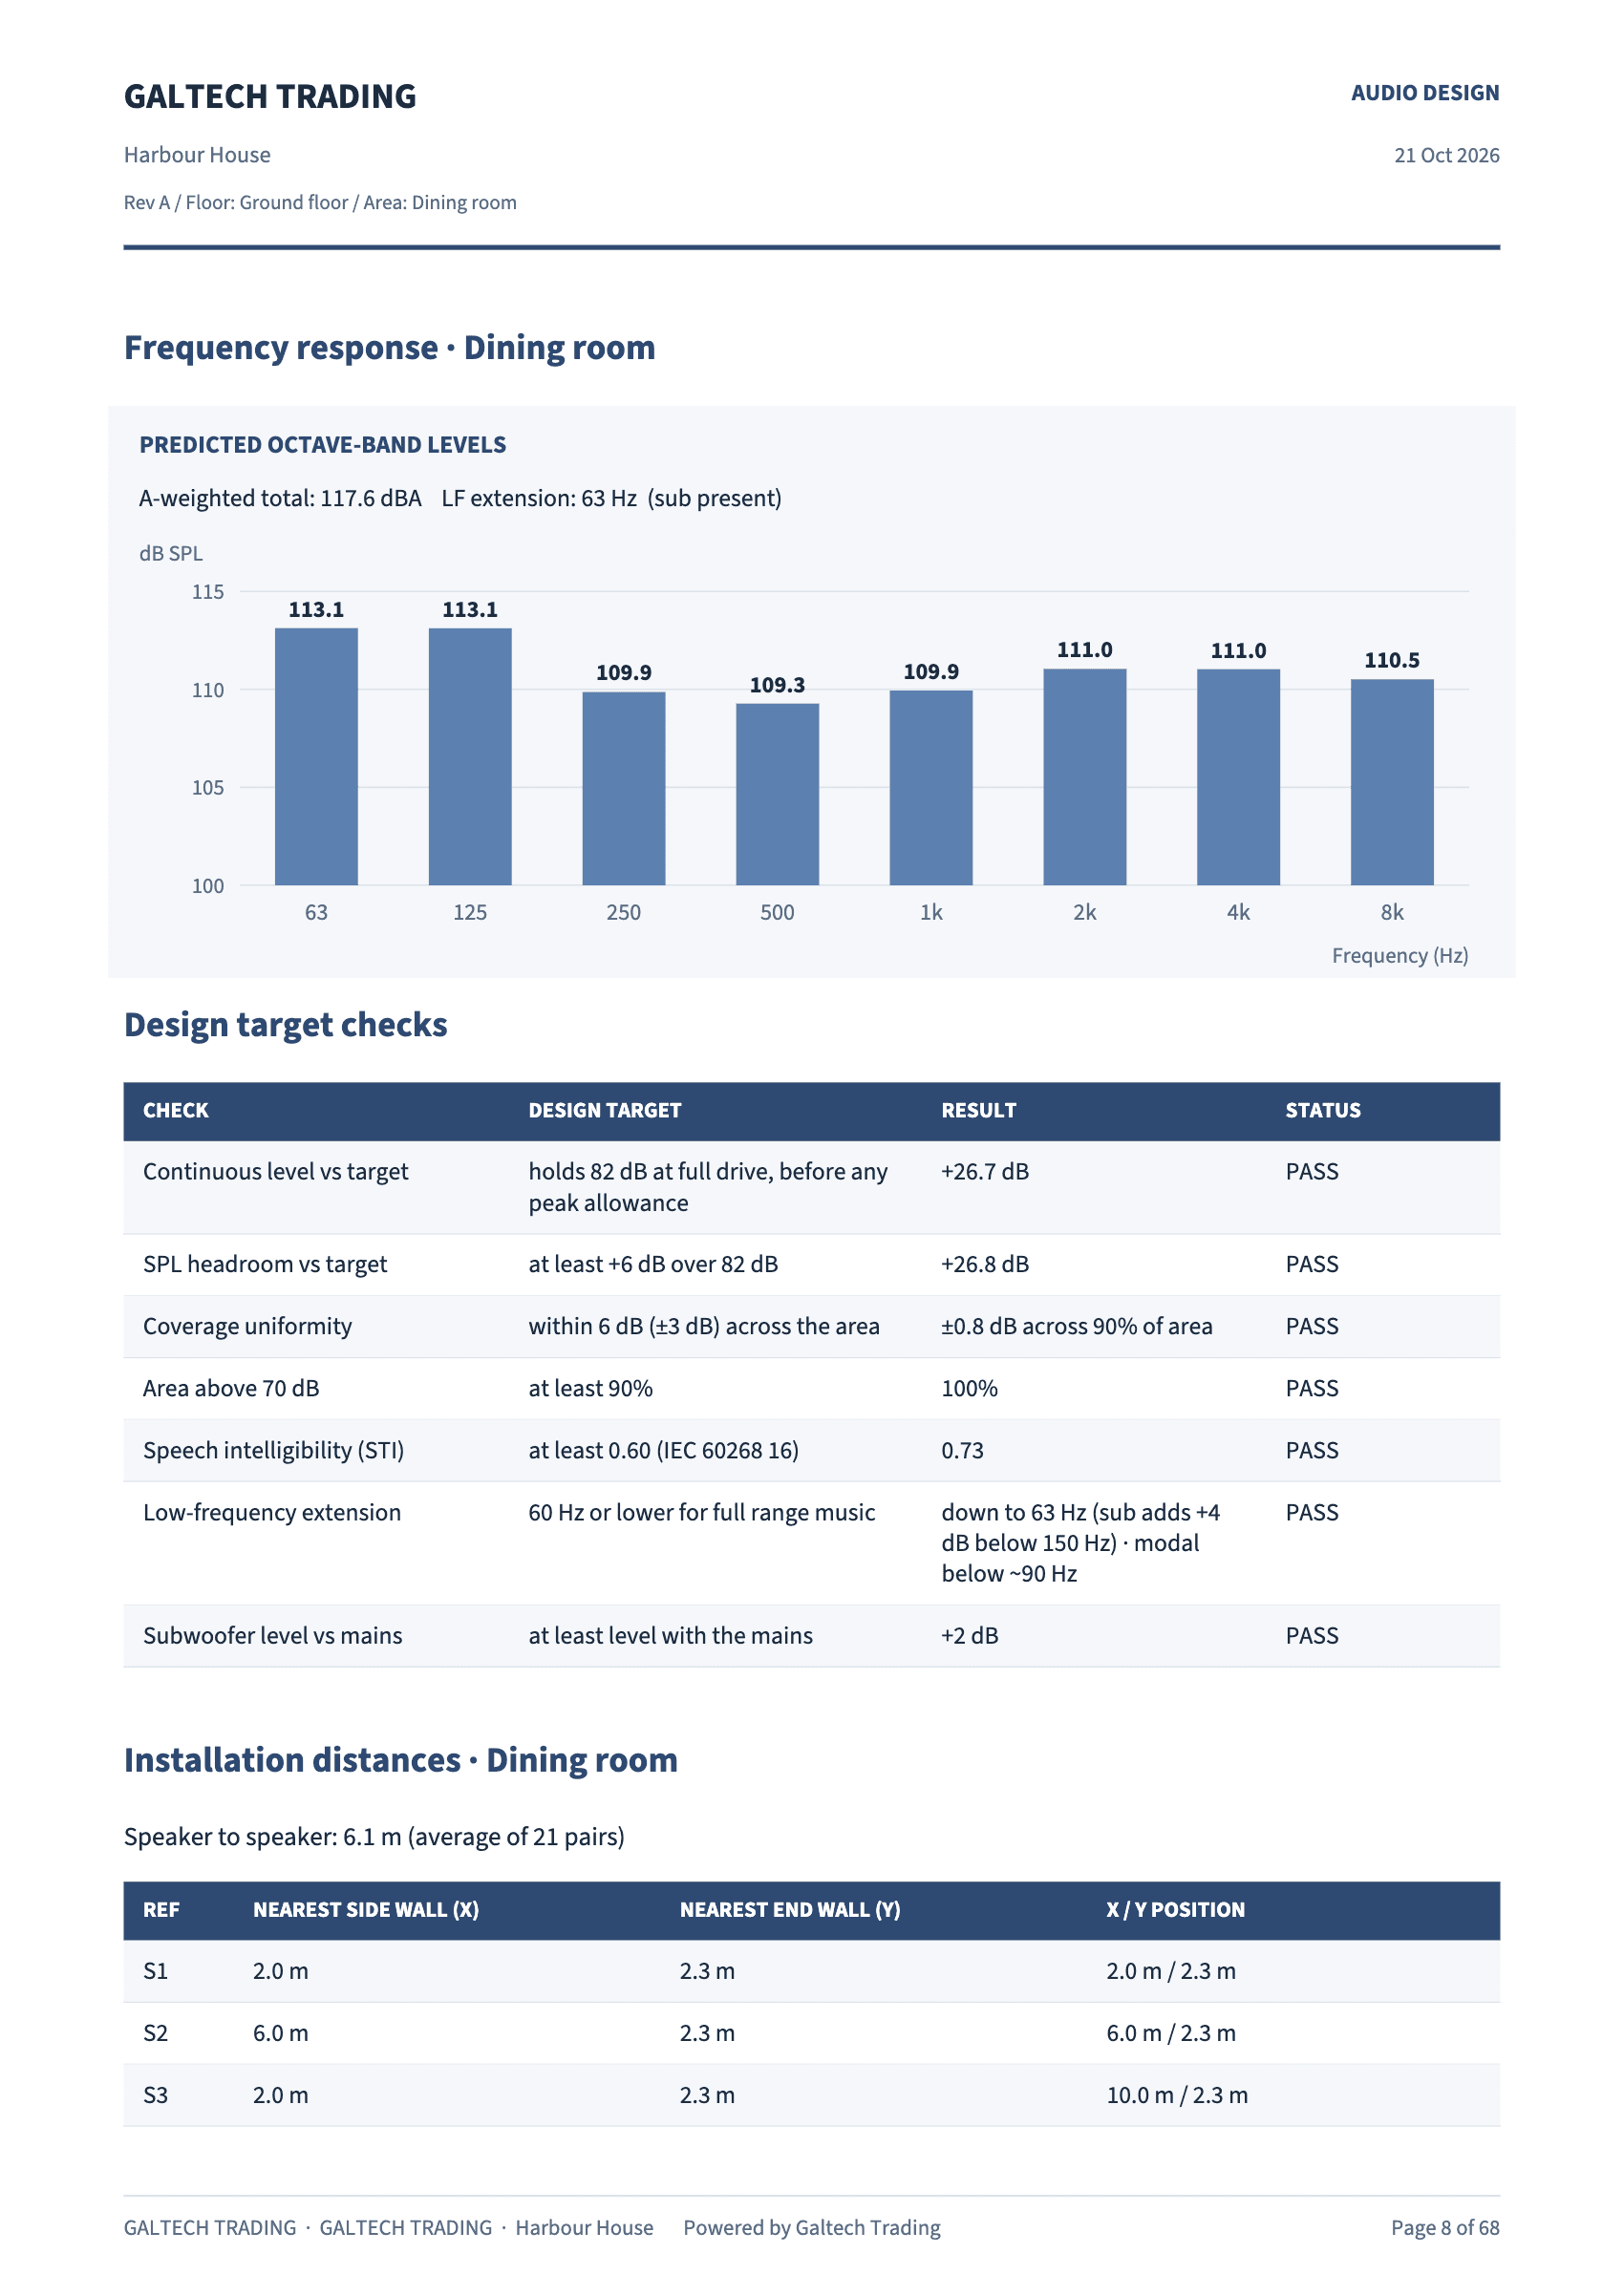
The analysis predicts the level in eight octave bands, from 63 Hz to 8 kHz. It accounts for each speaker’s frequency range, the way its directivity narrows as frequency rises, the reverberant field, the bass reinforcement a nearby wall or corner gives (to the bass only, not the treble), the compression a speaker shows near its rated power, and the air absorption over distance at the area’s temperature and humidity.
The A-weighted total, in dBA, sums it up as perceived loudness. LF extension reports the lowest band the system still reproduces well, flags when a subwoofer is needed, and marks the room’s modal region, below the Schroeder frequency, where bass predictions are approximate.
Speech intelligibility
The STI is calculated per IEC 60268-16, from the reverberation and from the area’s background noise. A noisy restaurant scores lower than a quiet boardroom at the same level. The standards check grades it against a target of 0.60.
When the area has a noise floor, you also get a signal-to-noise against ambient check: the system should sit 25 dB above the background for music and 15 dB above it for speech.
Clarity: C50 and C80
Clarity is the ratio of early sound to late, reverberant sound.
- C50 looks at the first 50 milliseconds and tracks speech. Aim for 0 dB or higher.
- C80 looks at the first 80 milliseconds and tracks music. Roughly −2 to +4 dB is well balanced.
Both come from the direct-to-reverberant balance and the RT60, so a livelier room lowers them. They are useful when you choose finishes or a speaker count.
Headroom: continuous first, then peaks
The continuous level is what the area reaches with every speaker at full drive, or less when the assigned amplifier splits a channel. An area that cannot hold its target continuously is short, whatever the peak figure says.
Peak capability adds each speaker’s peak allowance from its datasheet, but only as far as the amplifier can deliver it: an amplifier clips at its rating, and on a 70 V or 100 V line the transformer tap is the ceiling. With no amplifier assigned, the tool assumes adequate amplification. Good headroom means peaks reach 6 dB over the target.
Subwoofers and the numbers
A subwoofer plays below about 150 Hz, so it is kept out of the broadband figures: the heatmap, the average, the headroom, the coverage and the uniformity are the main speakers’. Adding a sub does not make an area read louder. It shows where it plays:
- the 63 Hz and 125 Hz octave bands,
- the low-frequency extension row, as the dB the sub adds below 150 Hz,
- the subwoofer level against the mains: level with them for background music, 6 dB above for a target of 100 dB or more,
- and the sound in the walk-in.
An area with only subwoofers still gets a map.
The standards check
The standards check gives a pass, marginal or fail against common design goals: the continuous level against the target, the headroom, the uniformity, the share of the area above the target, the STI, the signal-to-noise and the low-frequency support. It checks the design against these goals; the installed system still needs measuring on site.
Time alignment
With two or more speakers in an area, Auto-align sets each speaker’s delay so that their sound arrives together at the listening area: the farthest speaker gets none, the nearest the most. The delays go straight into the DSP preset. See Commissioning and tuning tools.