Analysis
Place the access points, see the signal through the walls.
Signal strength per band, through walls that cost what they should. Pick an access point from the library, click it into a room, and the signal map builds as you place it.
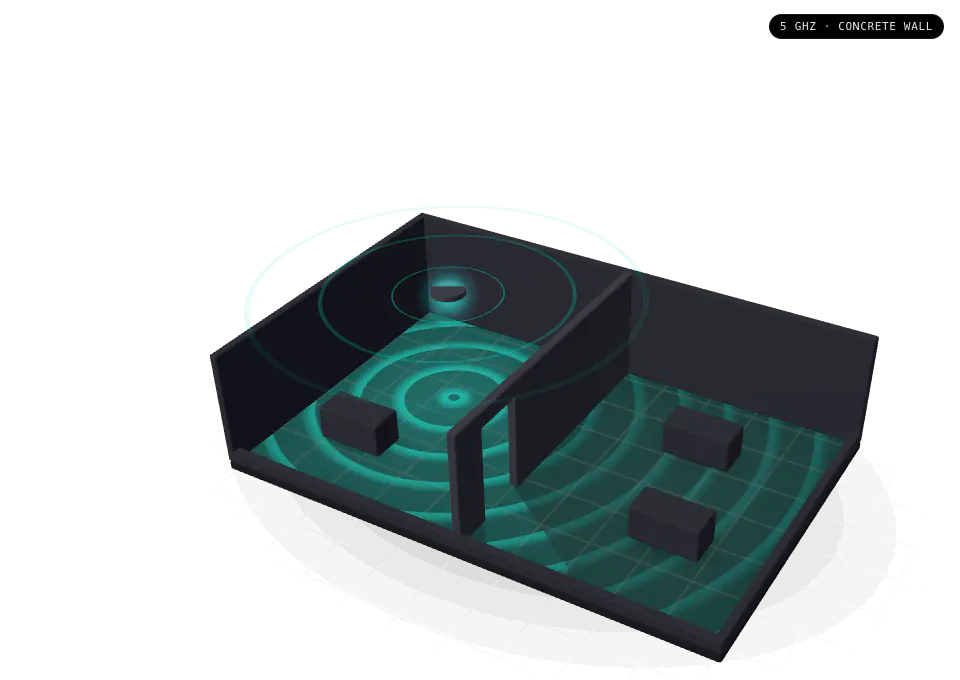
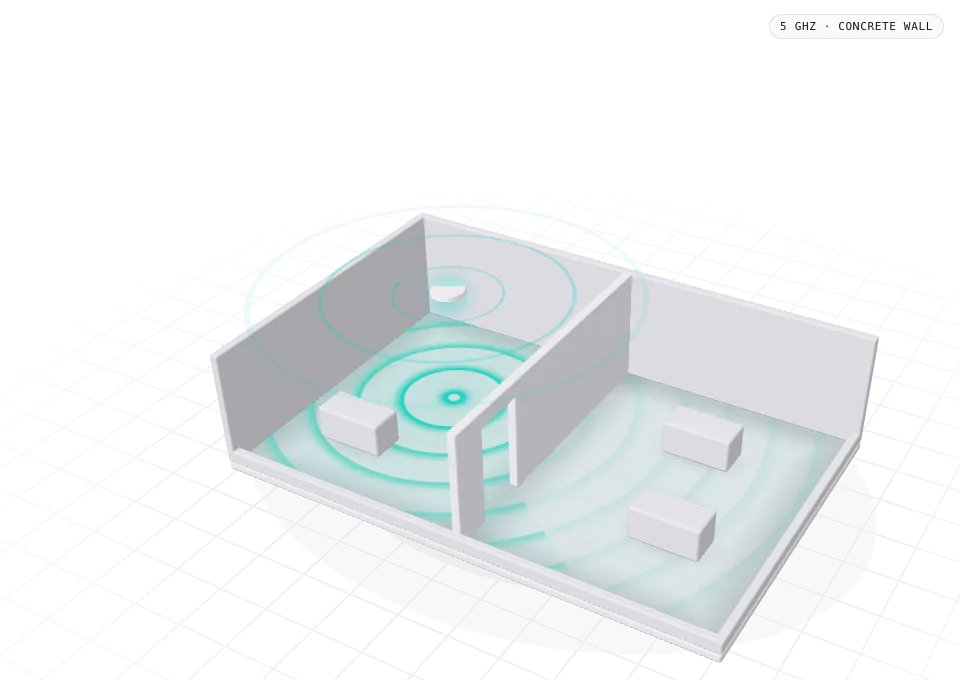
the signal map
Dead spots show the moment you place.
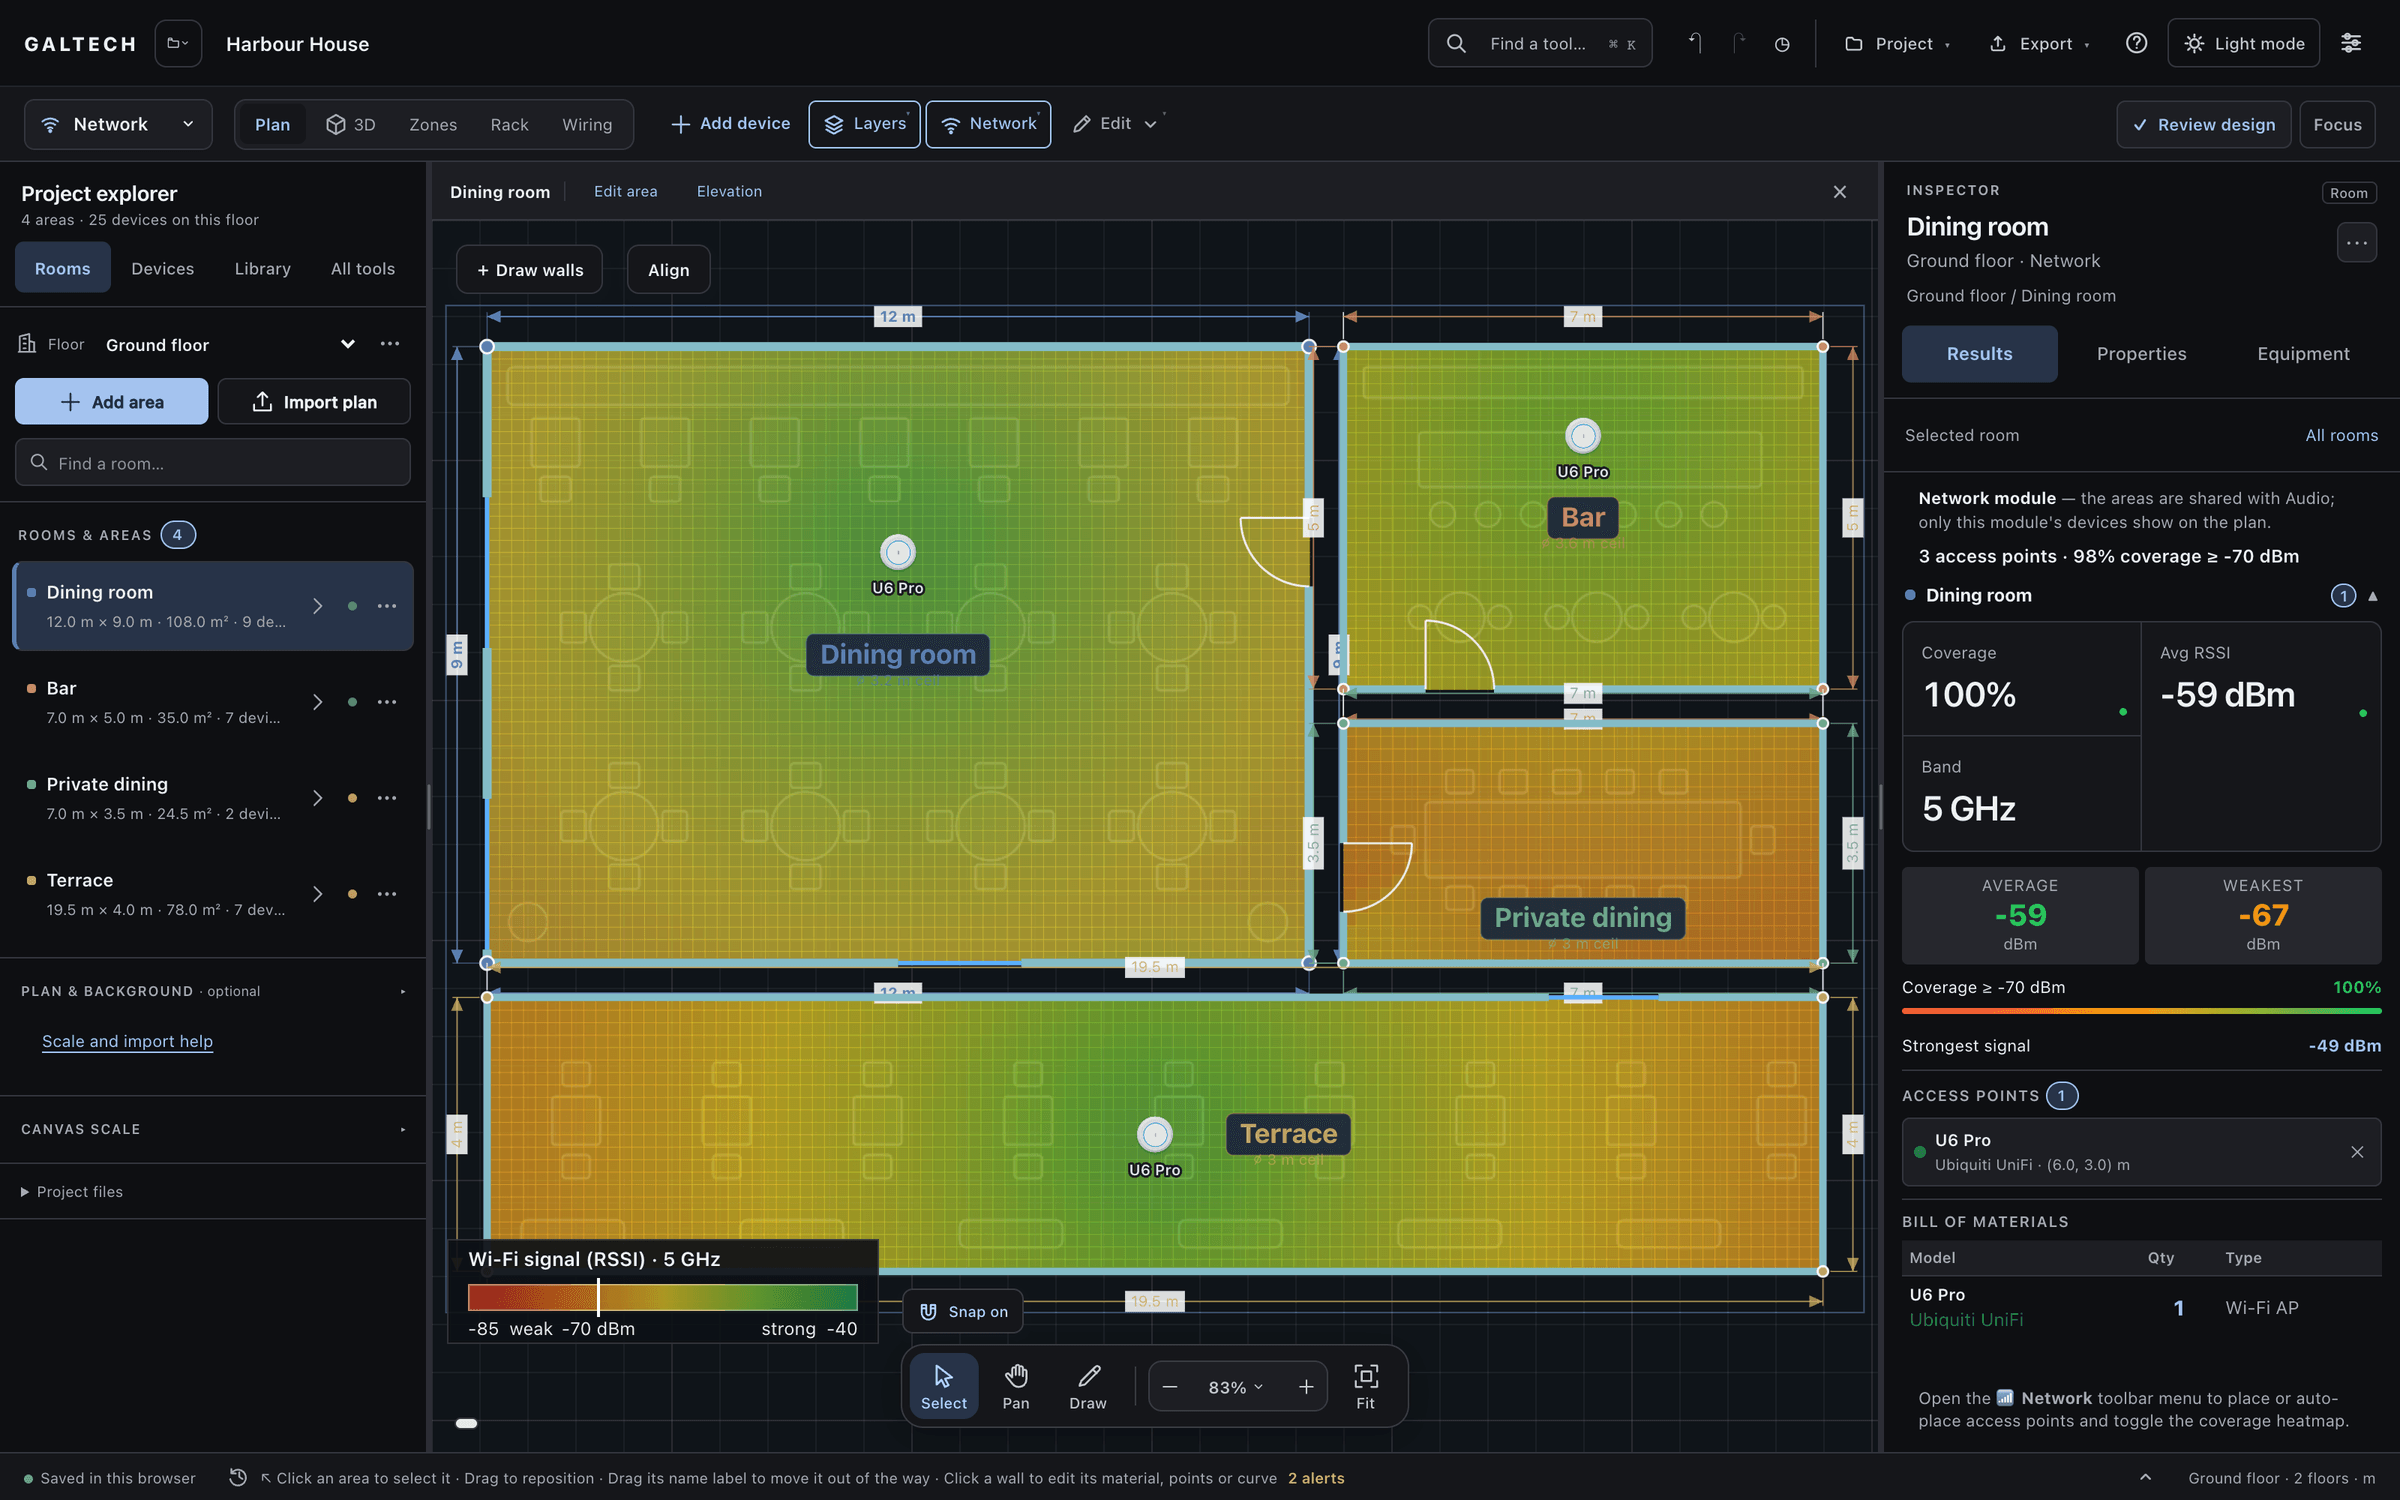
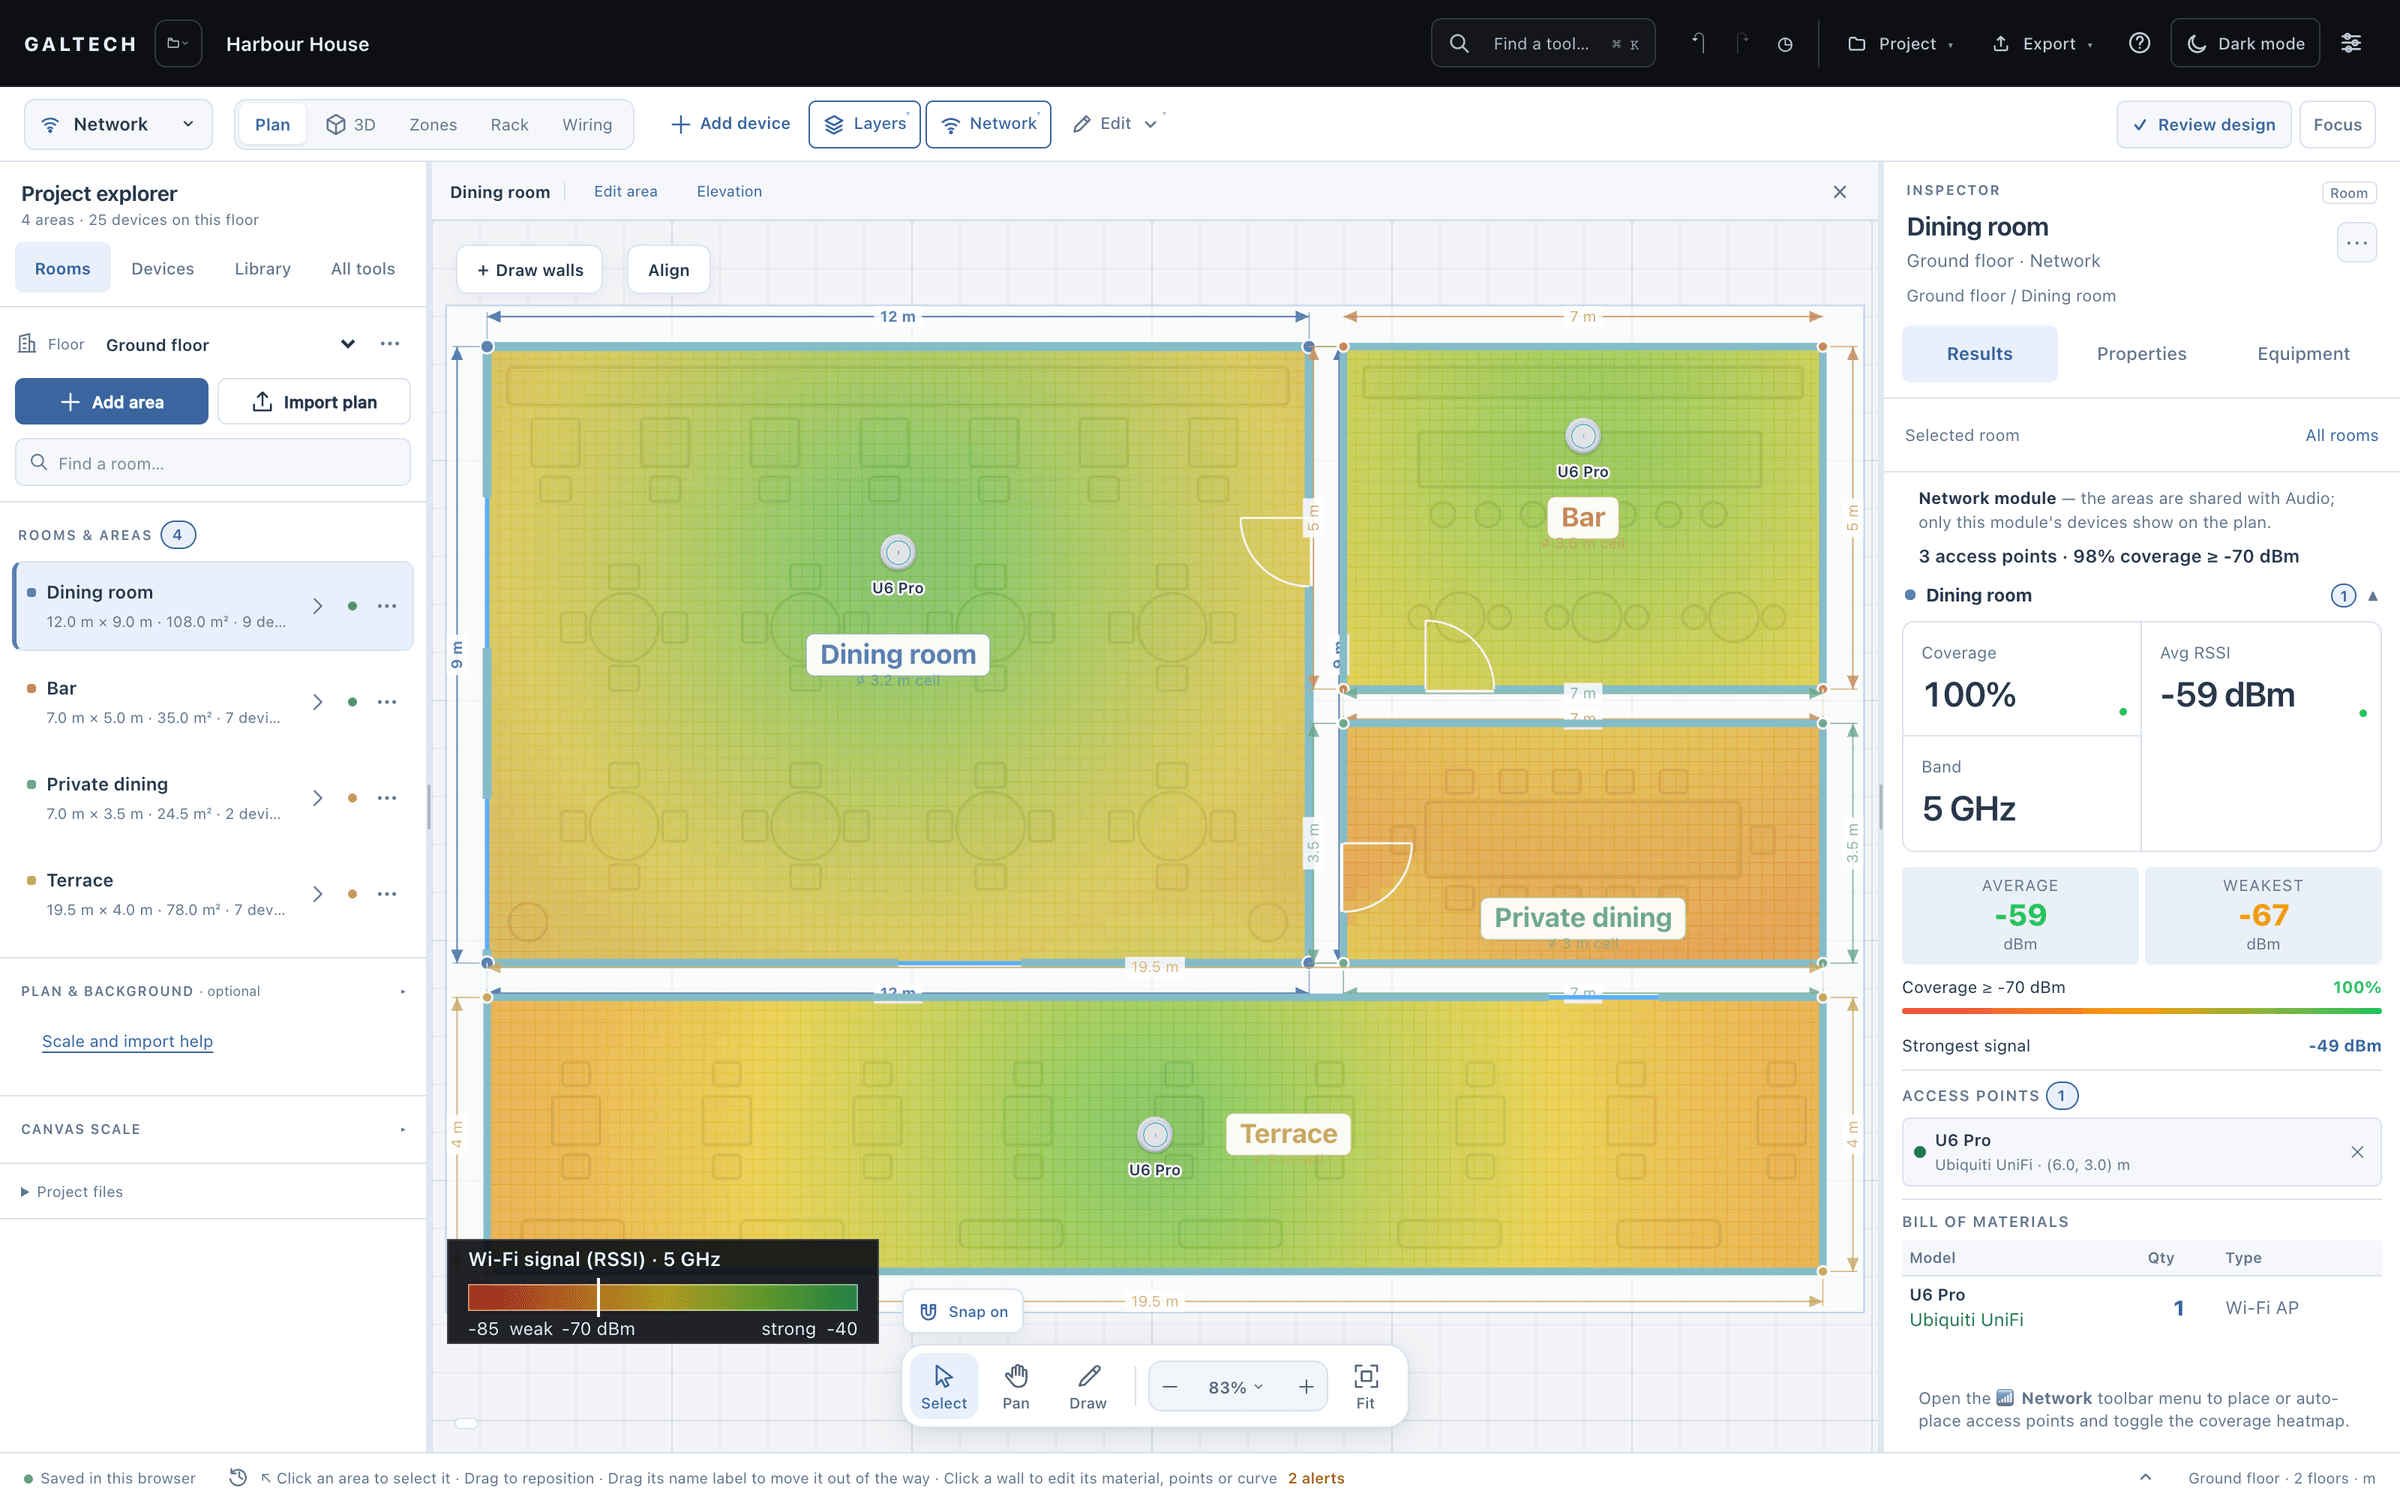
Switch to the Network module, pick an access point from the library and click inside a room. The signal map (RSSI) builds live, so dead spots show at once; drag an access point and the map follows. Good data coverage is −70 dBm or better, shown in green, on a scale from −85 to −40 dBm.
The results panel scores each area: the share of the area above the signal threshold, and the weakest spot. Add or shift access points until every room that matters is covered; a bedroom tolerates less signal than a home office.
The model follows the real slant from a ceiling access point down to the device, not the distance along the floor, so the peak right under an access point reads about −51 dBm rather than an impossible −33 dBm.
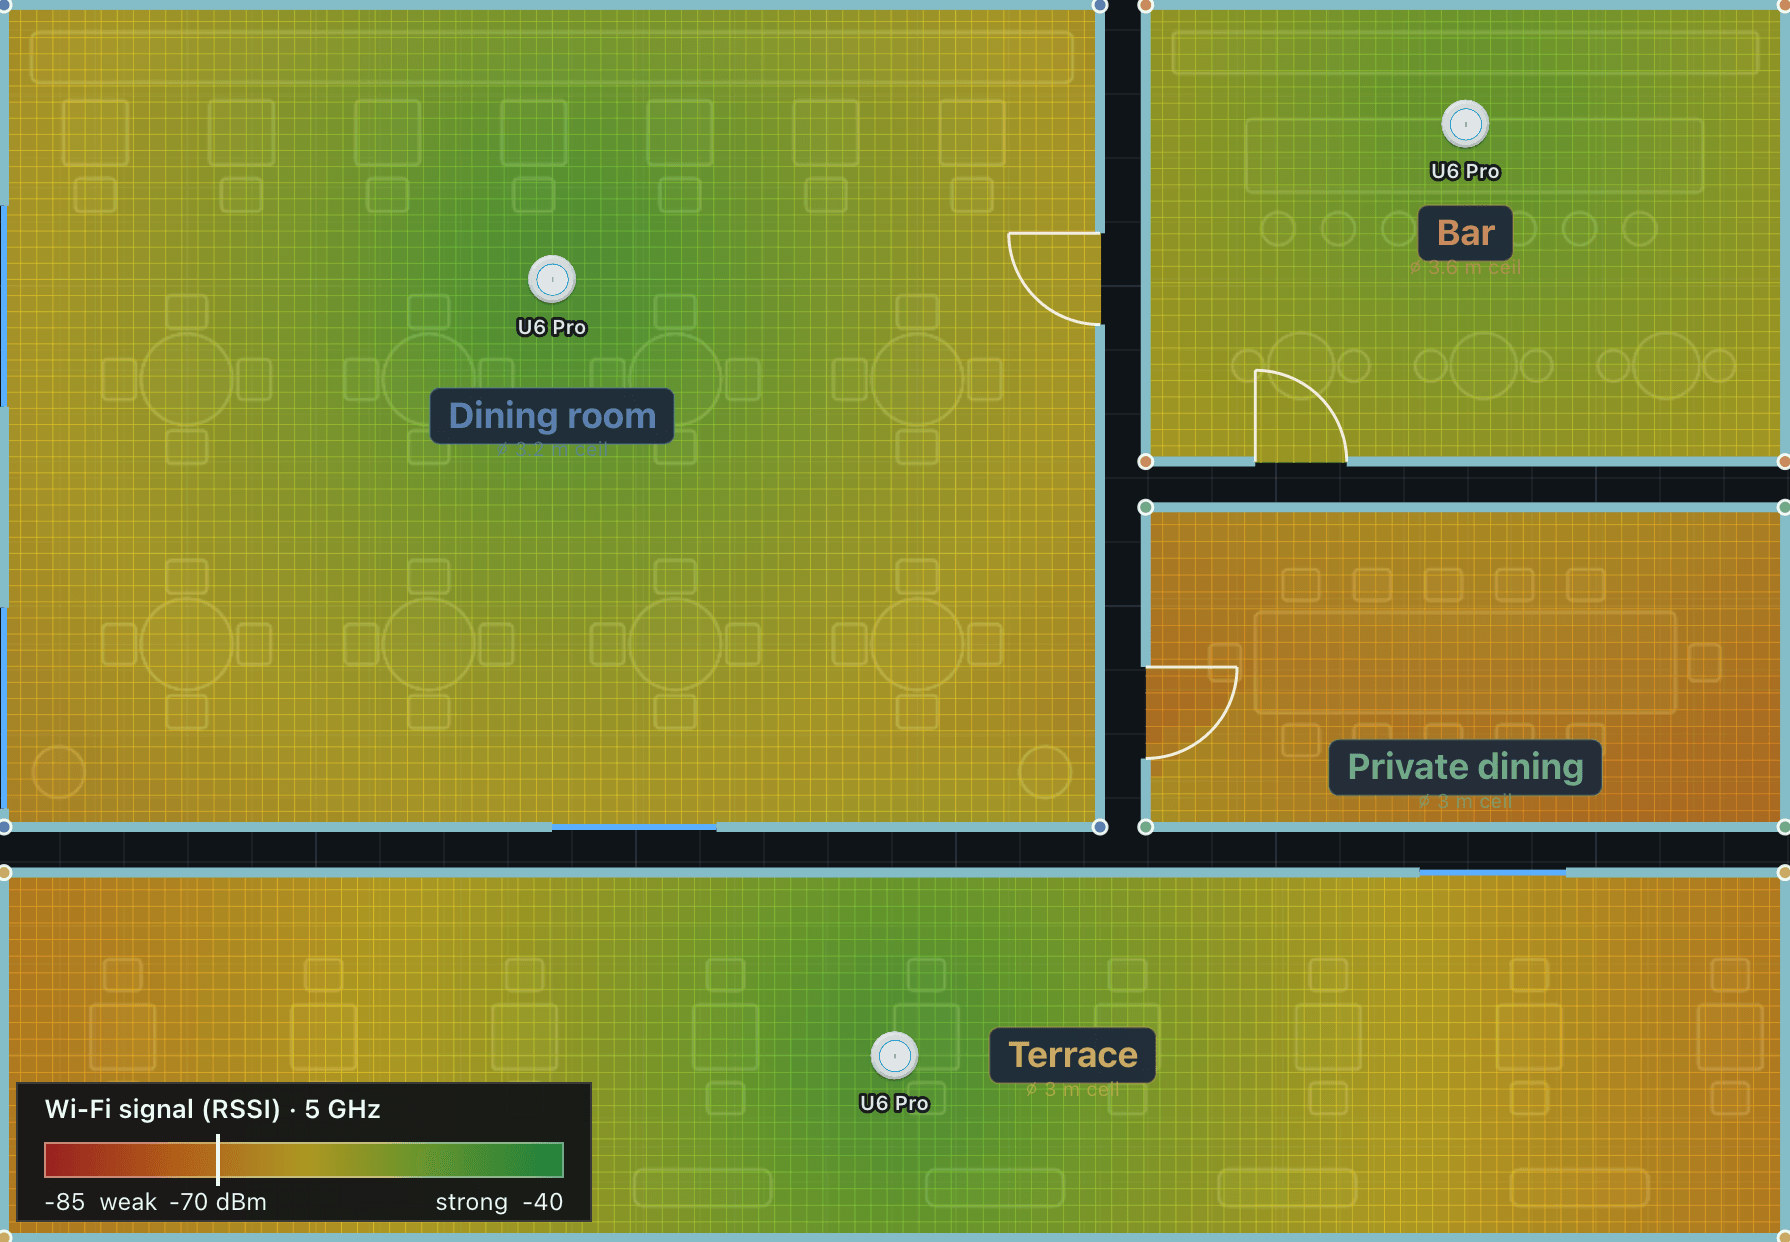
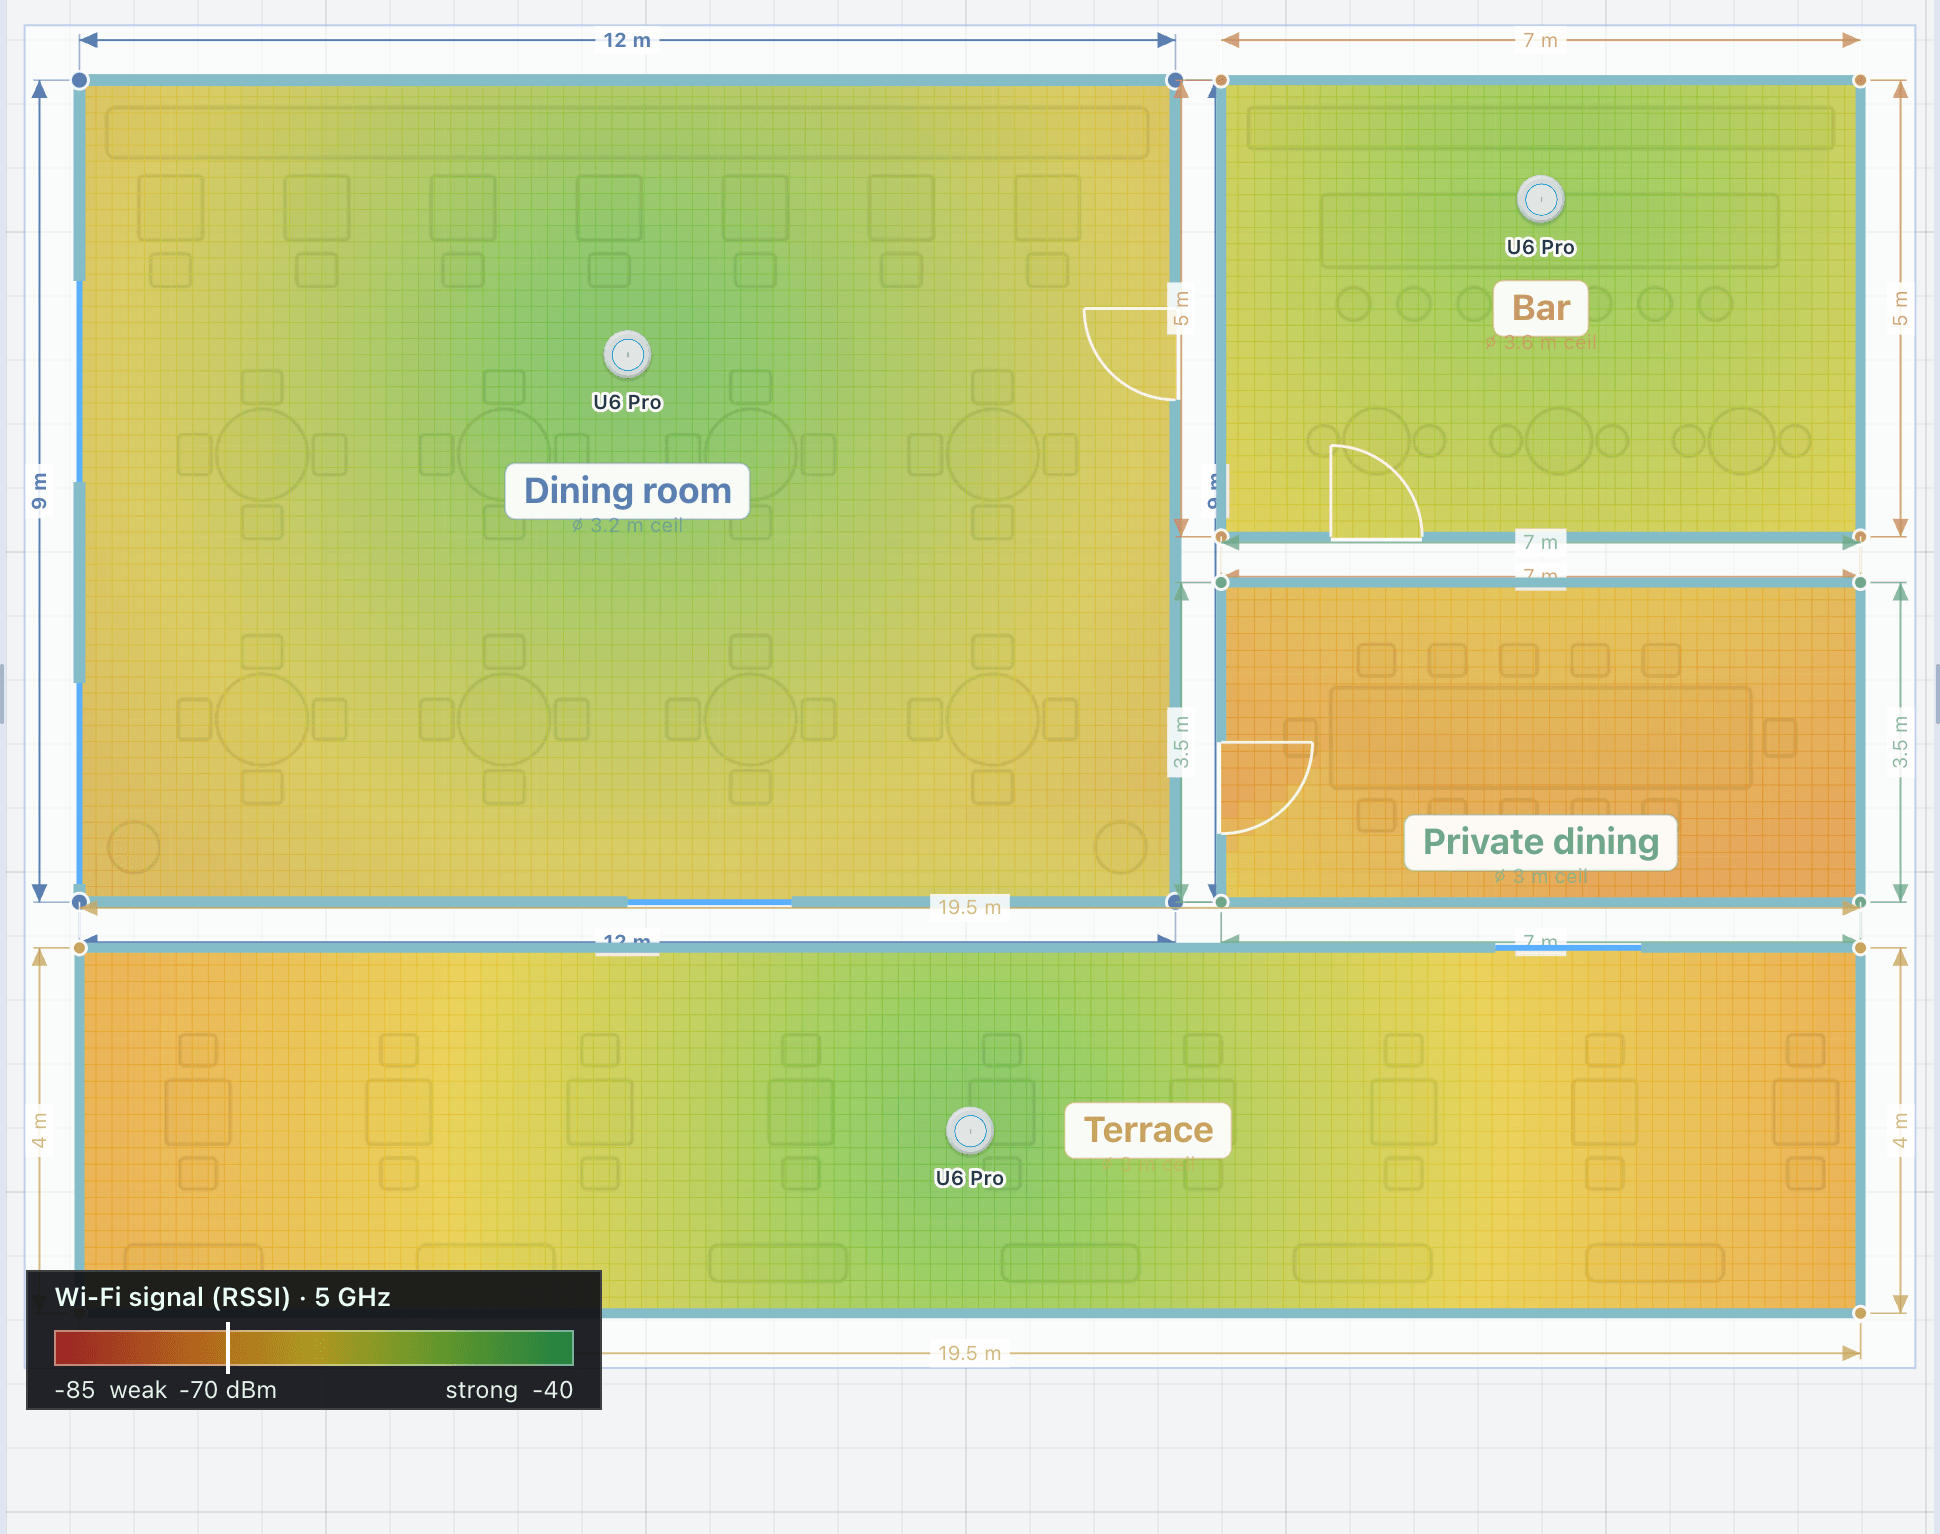
bands and walls
Three bands, and what each wall costs.
Check coverage per band, because walls absorb 2.4, 5 and 6 GHz differently. Set a wall material for the project, or per wall: concrete and stone cost far more signal than drywall or glass, and the map shows it. Each wall costs its loss once, even where two areas share it.
The material is the one the wall editor sets, shared with audio and 3D. The tool lists each material with its loss at 5 GHz, scaled per band: less at 2.4 GHz, more at 6 GHz.
| Glass, standard | 2 dB |
|---|---|
| Drywall, standard | 3 dB |
| Brick | 5 dB |
| Wood | 5 dB |
| Window, double pane | 7 dB |
| Metal | 10 dB |
| Concrete | 15 dB |
how it works
Place access points, then check the wired network.
Design Wi-Fi coverageTask guide 08 · 3 min
Select access points
Choose Network → Library. Search by model or family, then open Details to review the selected access point before placing it.
Compare coverage with the plan
In Layers, enable Wi-Fi coverage heatmap. Toggle it off to relate coloured regions to the walls, then enable it again and expand RSSI Scale. Review the radio band and wall materials in Network tools.
Check the wired network
Review the project inventory in Equipment, the Network results and the Wiring schematic. Check available switch ports and PoE capacity for access points, cameras and control panels together.
Keep in mind
Use the design as a planning estimate and validate radio coverage on site. Different bands and wall materials can change the result.
Lesson 04 · 8:39Network, CCTV, video and automation
- 0:00Network: the plan
- 0:41Access points and switches
- 1:02Network layers
- 1:11The Wi-Fi heatmap
- 1:52Network tools
- 2:10Network results
- 2:27Ports and PoE
auto-place
A coverage target, and just enough access points.
Set the target coverage, from 80 to 100%, and press Auto-place access points: the tool positions just enough access points to reach the target in every area. Drag any of them afterwards and the map follows.
The library lists every access point with its photo, bands, gain and PoE draw. Add a model you need with its ports, PoE and rack units, and it joins the library, the rack, the wiring diagram and the bill of materials.
the wired side
Every access point needs a switch port.
Every networked device in the project needs a switch port: access points, cameras, touch panels, audio players and AV over IP video. The tool counts them against the switches you add and warns the moment the ports run out; the warning clears once you add a switch.
Access points appear on the wiring diagram wired to the network switch over PoE. The Wi-Fi report prints the coverage map, the access point schedule with mounting locations and the switch summary, on its own or inside the combined report.
Validate on site
Use the design as a planning estimate and confirm radio coverage on site. Different bands and wall materials can change the result.
in figures
The network, in figures.
- bands
- 2.4, 5 and 6 GHz
- access points in the catalogue
- 20
- or better: good data coverage
- −70 dBm
- dining room average (demo)
- −59 dBm
| Signal map | RSSI per band, from −85 to −40 dBm |
|---|---|
| Coverage | The share of each area above the threshold, and the weakest spot |
| Walls | Loss per material, counted once per wall |
| Auto-place | To a coverage target of 80 to 100% |
| Ports | Every networked device counted against your switches, with a warning |
| Report | Coverage map, access point schedule and switch summary |
questions
Questions, answered plainly.
Does the tool size my network switches?
It counts every device that needs a port against the switches you add and warns when they run out. Choosing the switch is yours; in the rack, a switch brings its patch panels with it.
Is the signal map a site survey?
No. It is a prediction for planning: validate radio coverage on site. Different bands and wall materials change the result, so check the band you will deploy.
Which access points are in the library?
20 models: named models from Aruba Instant On, Cisco, Grandstream, Ruckus, TP-Link and Ubiquiti, and generic Wi-Fi 6 and 6E access points. You can add your own. A product in the catalogue does not mean a partnership.
Ready when the client is.
Draw it, check it, show it, price it and hand it over, from one project.
15-day trial for approved companies. No card, nothing to cancel.