On this page
On a floor plan, an access point in the hallway looks close to every room. To the radio, each wall in between is a toll. This article is about those tolls: what the bands do, what walls cost, which signal levels to design for, and where access points belong.
Three bands, three trade-offs
| Band | Reach | Worth knowing |
|---|---|---|
| 2.4 GHz | The furthest | Only three non-overlapping channels in most regions, crowded by neighbours and older devices |
| 5 GHz | Shorter | Many more channels: the workhorse of most designs |
| 6 GHz | The shortest | The most spectrum, where the regulator allows it. Needs Wi-Fi 6E or Wi-Fi 7 devices |
Higher frequencies lose more even in open space: over the same distance, 5 GHz arrives about 6 dB weaker than 2.4 GHz, and 6 GHz about 8 dB weaker, before a single wall is counted. They also lose more through most materials. What they give back is capacity: more channels, wider channels and less interference. Design for the band your clients will actually use for what matters, and check the others.
What walls cost
Every wall between an access point and a device takes decibels away. These are the planning values the tool uses at 5 GHz:
| Material | Loss at 5 GHz |
|---|---|
| Thin glass | 1 dB |
| Standard glass, glass door | 2 dB |
| Standard drywall | 3 dB |
| Heavy-duty drywall, single-pane window | 4 dB |
| Brick, wood, wooden door | 5 dB |
| Double-pane window | 7 dB |
| Metal, metal door, triple-pane window | 10 dB |
| Concrete | 15 dB |
The model scales these down by about a third at 2.4 GHz and up by about a sixth at 6 GHz, so a concrete wall costs about 10 dB at 2.4 GHz and about 17.5 dB at 6 GHz. Each wall is charged once, whichever room it was drawn from.
Treat the table as a starting point, not a survey. Reinforced concrete, metal studs, foil-backed insulation, mirrors, lift shafts and coated low-emissivity glass can all cost far more than their plain versions, and a large aquarium or a crowd of people absorbs signal too. When a wall matters, measure one on site.
The numbers to design for
Signal strength, or RSSI, is quoted in dBm as a negative number: the closer to zero, the stronger.
| RSSI | What it usually supports |
|---|---|
| −50 dBm or better | Excellent, close to an access point |
| −67 dBm | A common target for voice and video calls |
| −70 dBm | A good data signal, and the tool’s coverage threshold |
| −80 dBm | Marginal: slow and unreliable |
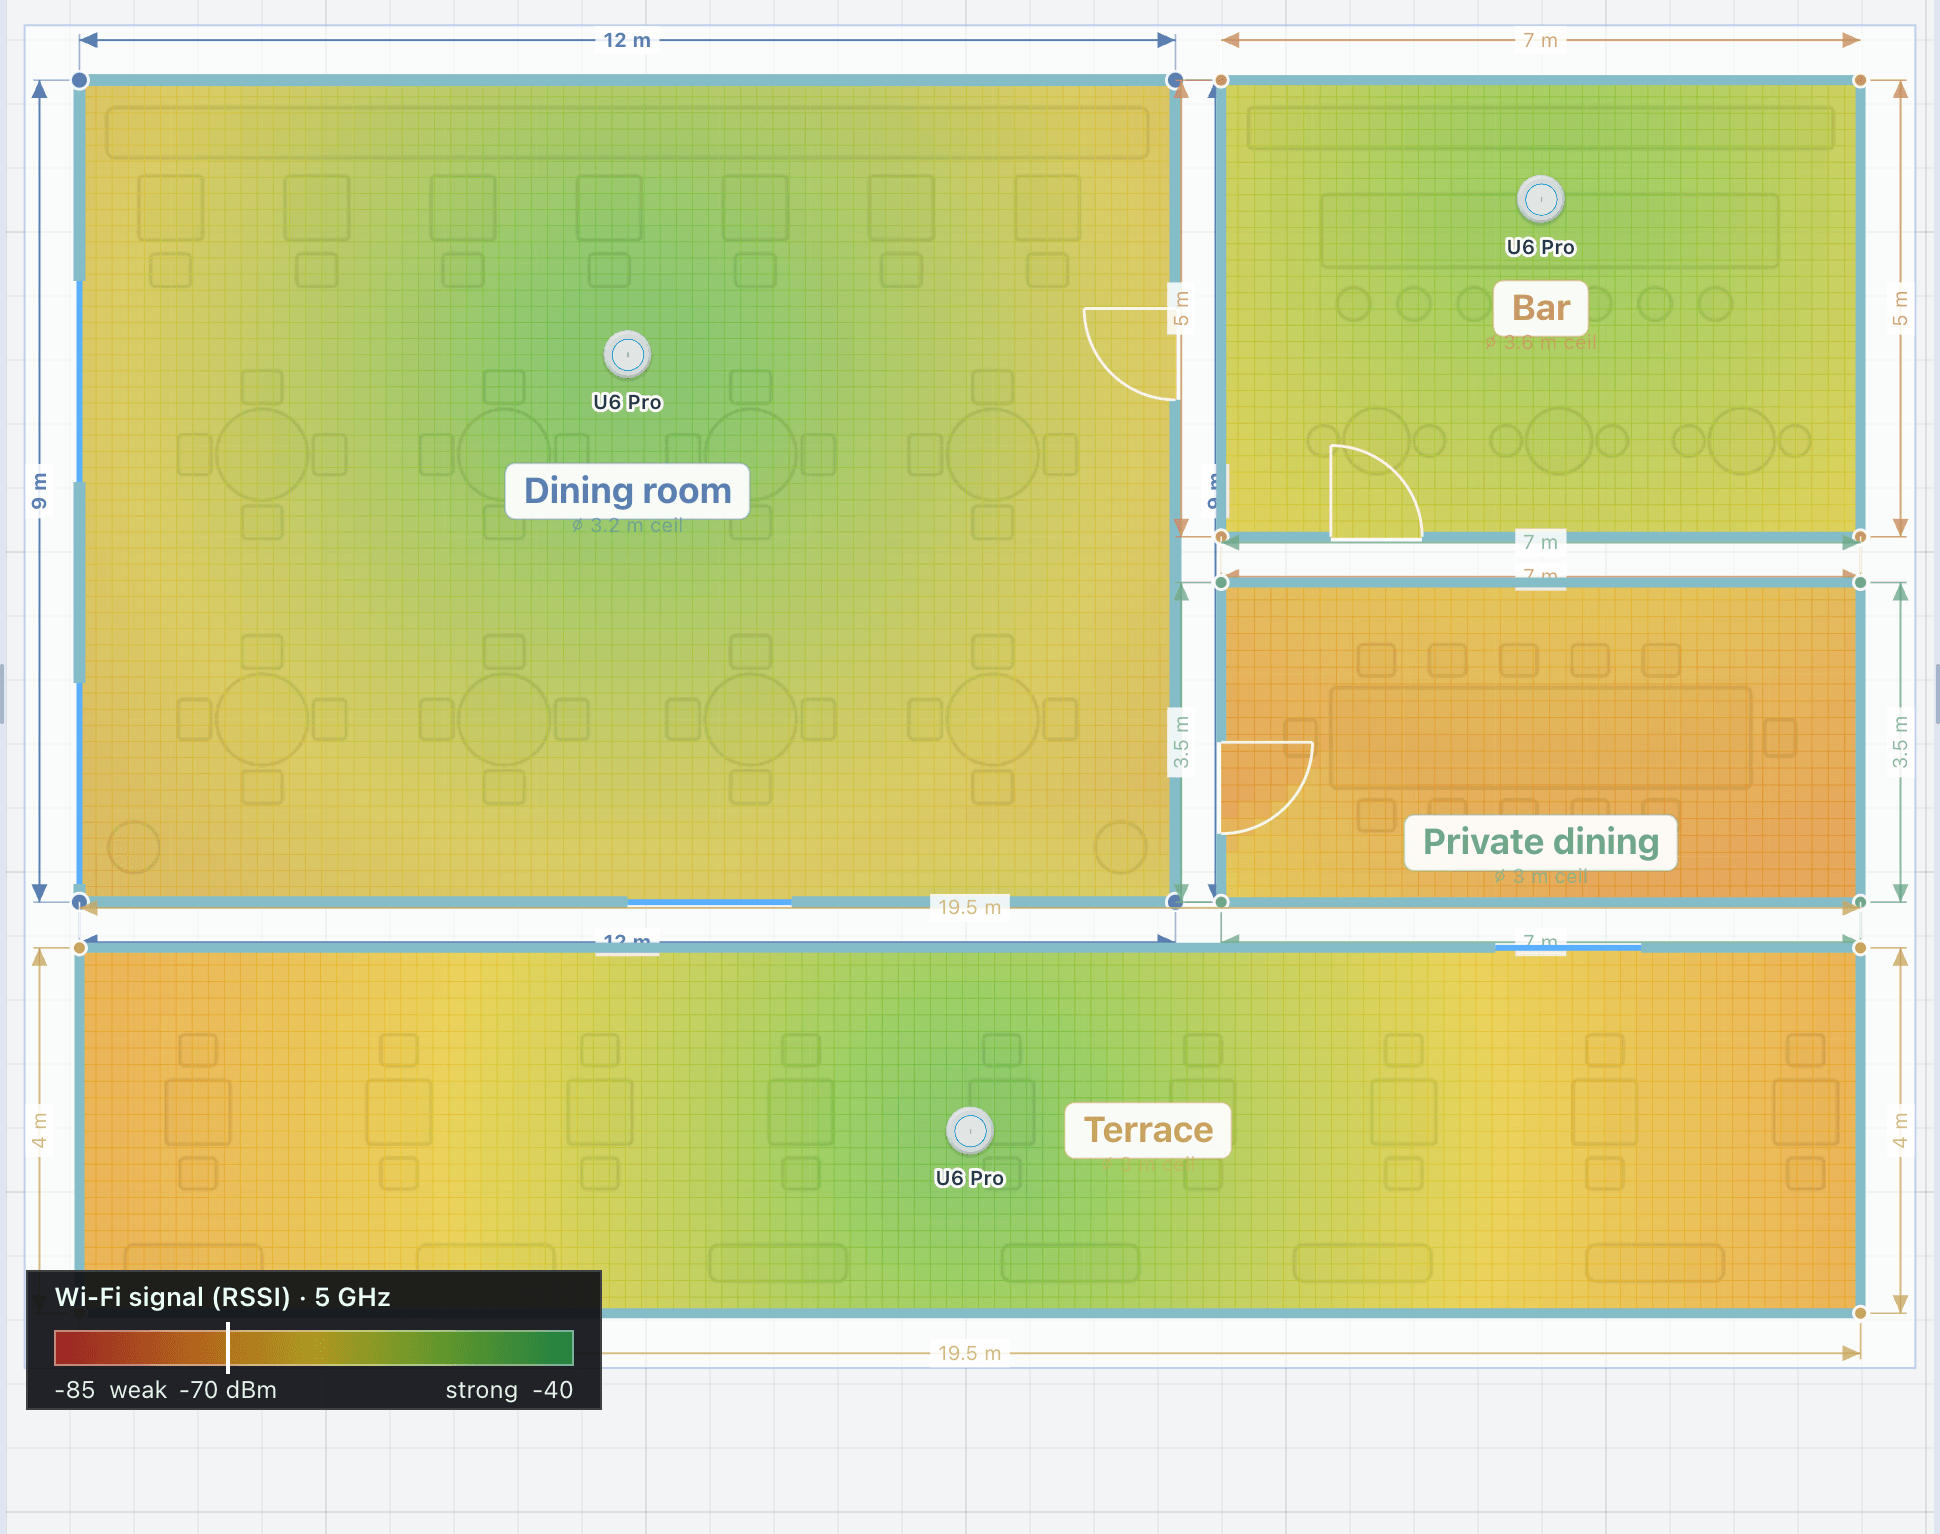
The tool reports each area’s coverage as the share of its floor at −70 dBm or better, along with its weakest spot. Designs for voice and video aim for −65 to −67 dBm instead.
Signal strength is not the whole story. The noise floor and interference from neighbouring networks matter as much, and many voice designs also ask for a signal-to-noise ratio of about 25 dB. A phone also transmits with much less power than an access point, so a link can look healthy from the access point’s side and still struggle on the way back. Design for the weakest device you expect.
A worked example
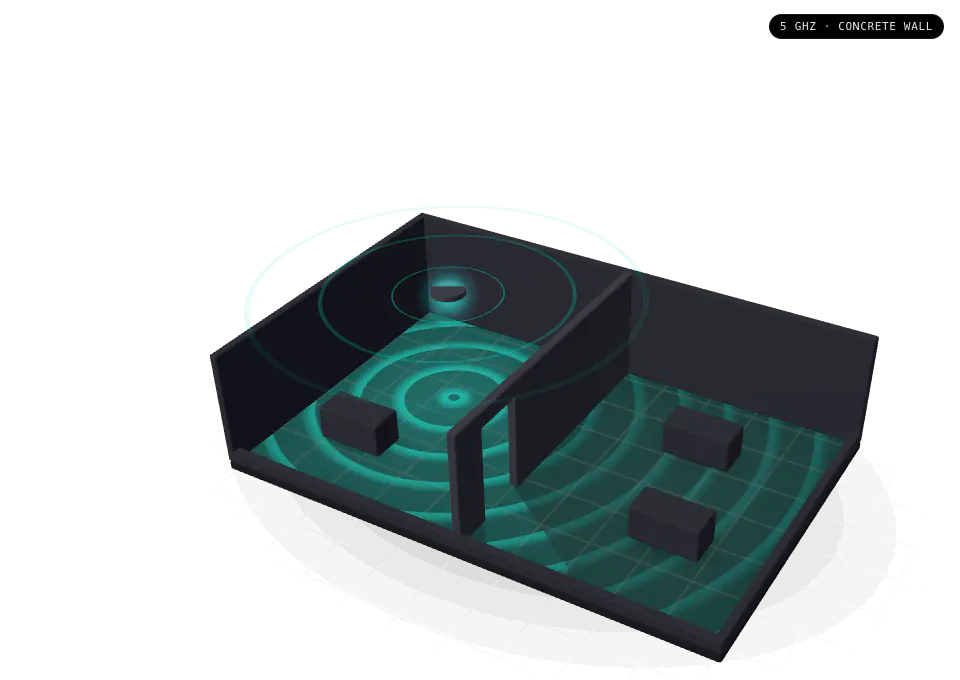
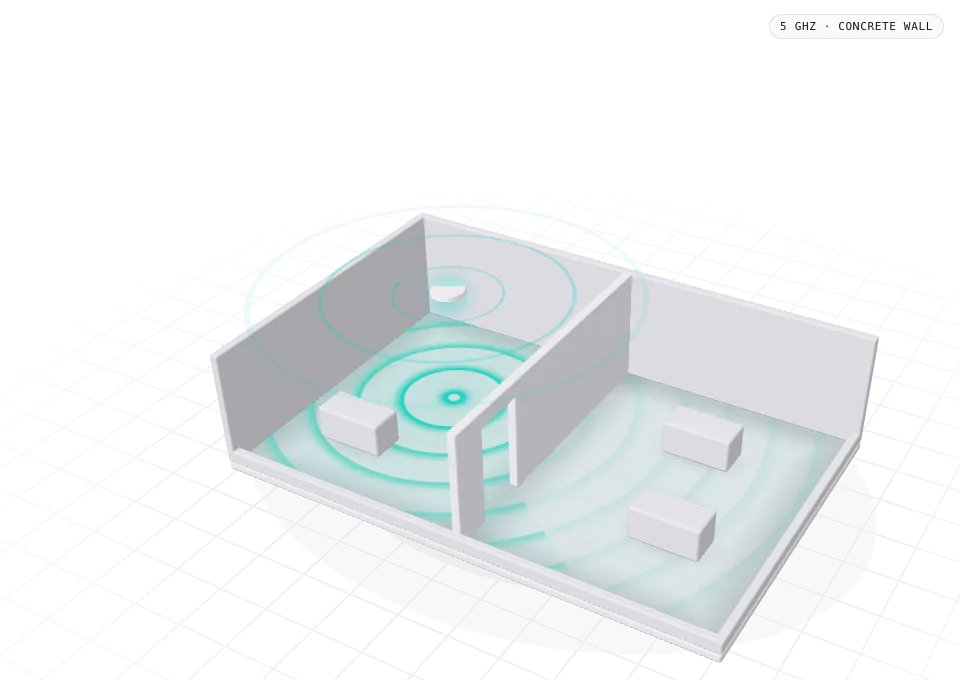
The tool’s indoor model starts from about −42 dBm at 1 m from a typical access point on 5 GHz and loses about 30 dB for every tenfold increase in distance, plus the walls. Six metres away, that gives:
- about −65 dBm in the same room;
- about −70 dBm through one brick wall;
- about −80 dBm through one concrete wall.
Same distance, same access point: one wall decides whether the room is covered. The example leaves out the mounting height; the model itself measures the slant from a ceiling access point down to the device.
Where access points belong
- In the rooms where the devices are, not in the corridor outside them. A corridor access point covering four rooms through four walls is the most common weak design.
- On the ceiling, central to the area it serves and clear of metal: not in a cupboard, a rack or above a metal ceiling.
- Enough to overlap, so devices can roam, at moderate power. More access points at lower power beat fewer at full power, especially on 2.4 GHz, where channels are scarce.
- Outdoors, with outdoor-rated access points of their own.
- With a switch port each. Every access point needs one, usually with power over Ethernet. The tool counts every networked device in the project, from access points to cameras, touch panels and players, against the switch ports you have, and warns when they run short.
In the tool
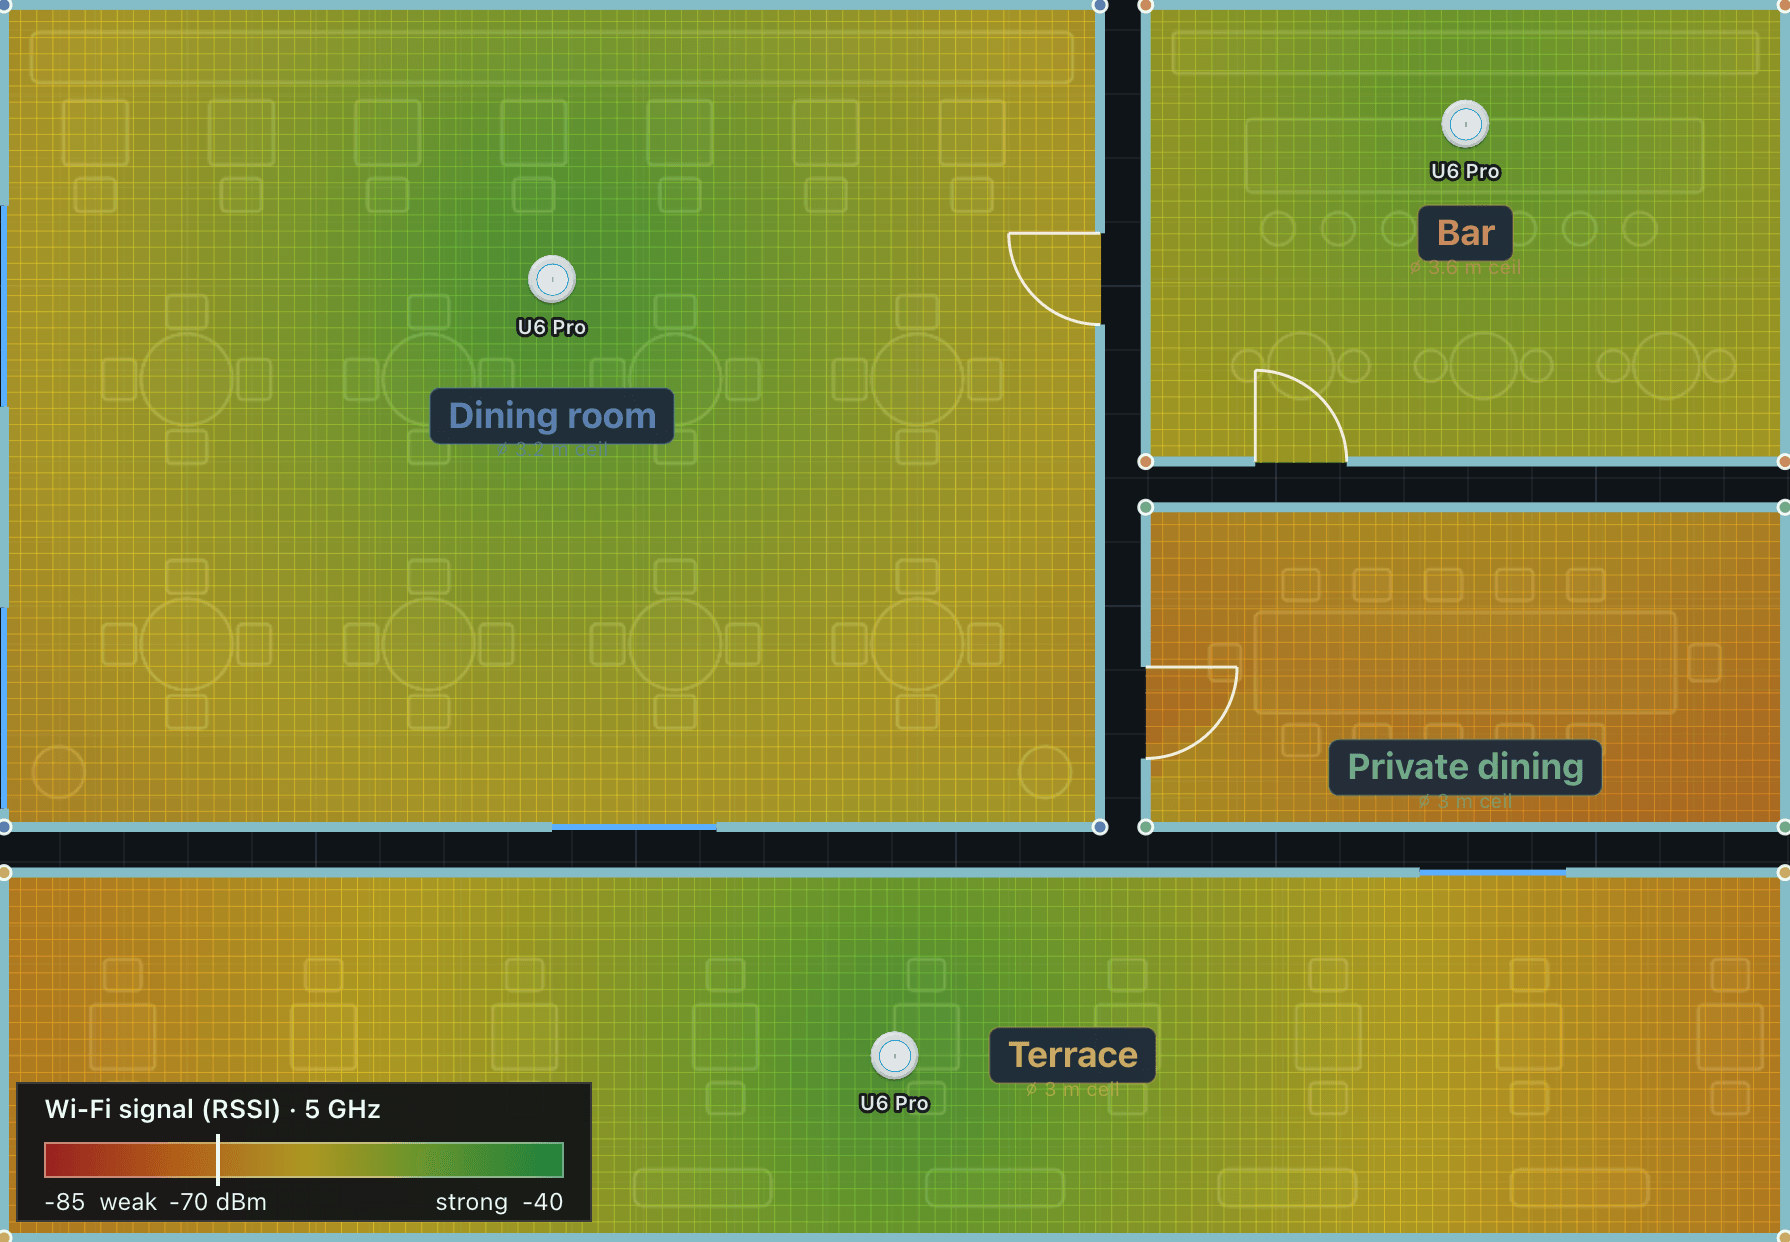
Pick an access point from the library, click inside a room, and the signal map builds for the band you choose. Set a material for each wall, or one for the whole project, switch bands to compare them, and read each area’s coverage and weakest spot in the results. Auto-place positions just enough access points to reach a coverage target from 80 to 100% in every area; drag them afterwards and the map follows. The Wi-Fi report prints the coverage map and an access point schedule with mounting locations.
The model is a planning estimate. Validate the radio coverage on site with a wireless survey, ideally before the ceilings close.