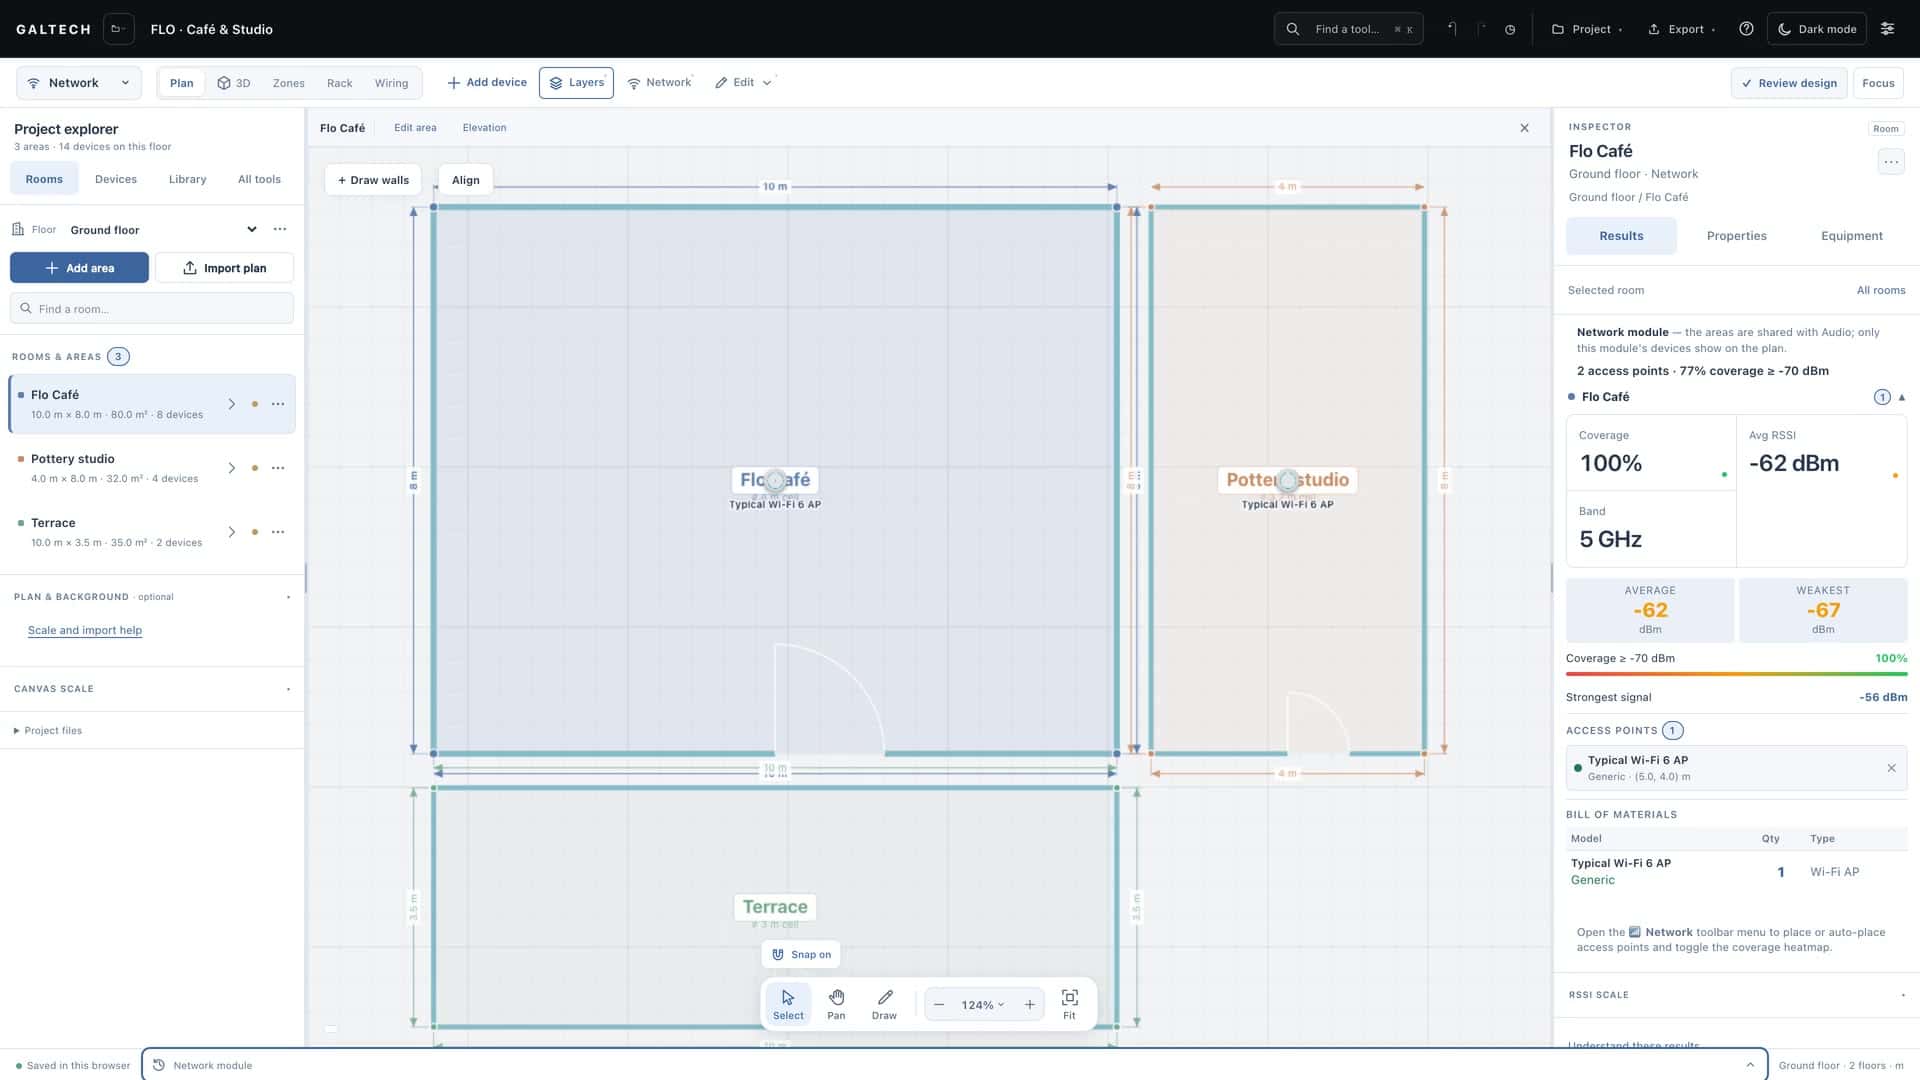
How many access points, and where?
Set a coverage target between 80 and 100%, and Auto-place access points puts just enough in each area to reach it. Drag any of them afterwards and the heatmap follows.
Auto-place
Wi-Fi, 02
Place access points from the catalogue and a heatmap shows the predicted signal per band, 2.4, 5 and 6 GHz, with every wall’s material taking its share. Auto-place to a coverage target, then read each area’s coverage and its weakest spot.
what it answers, 04
Set a coverage target between 80 and 100%, and Auto-place access points puts just enough in each area to reach it. Drag any of them afterwards and the heatmap follows.
Auto-place
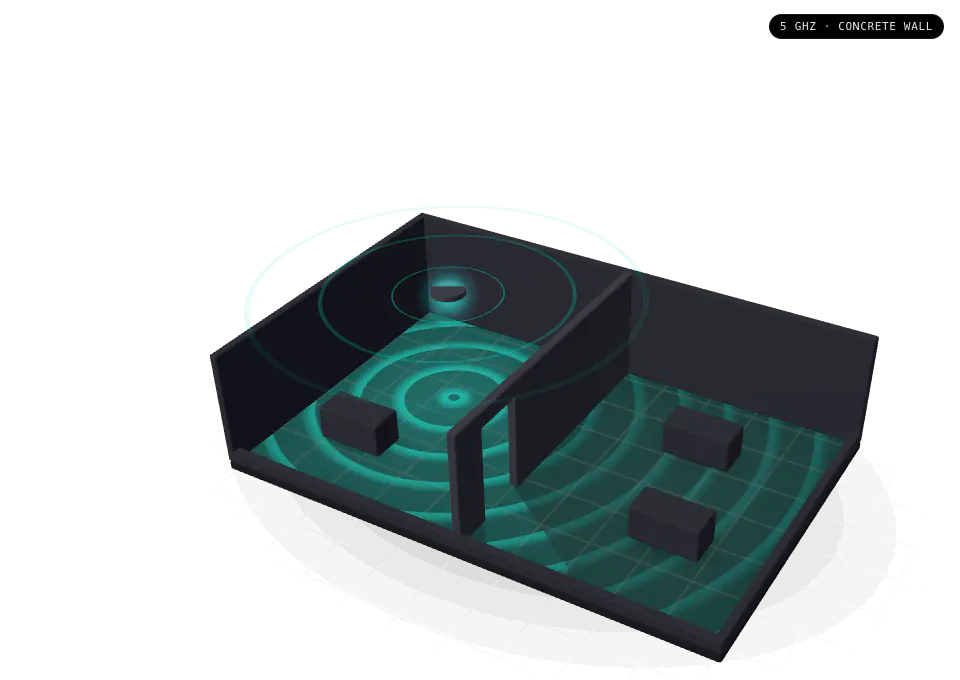
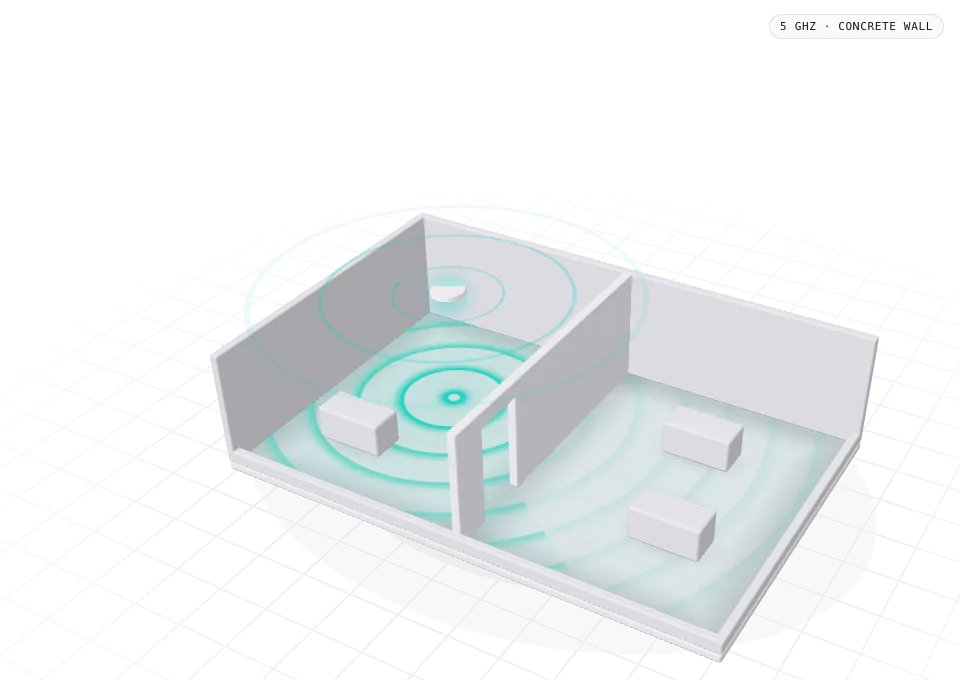
Give the project, or any single wall, its material. Concrete and stone take far more signal than drywall or glass, and the walls you set for the audio design already count here.
Wall materials
Check each one, 2.4, 5 and 6 GHz, because walls absorb them differently. The tool’s lesson puts it simply: 5 GHz is faster with a shorter reach, 2.4 GHz reaches further through walls, and most installs plan for 5 GHz and let 2.4 GHz fill the gaps.
Network tools
Access points, cameras, touch panels, audio players and AV-over-IP video all need a switch port. The tool counts them across the whole project against your switches and warns the moment the ports run short.
Port check
how it works, 05
The steps of the tool’s Wi-Fi guide, and the first part of lesson 04.
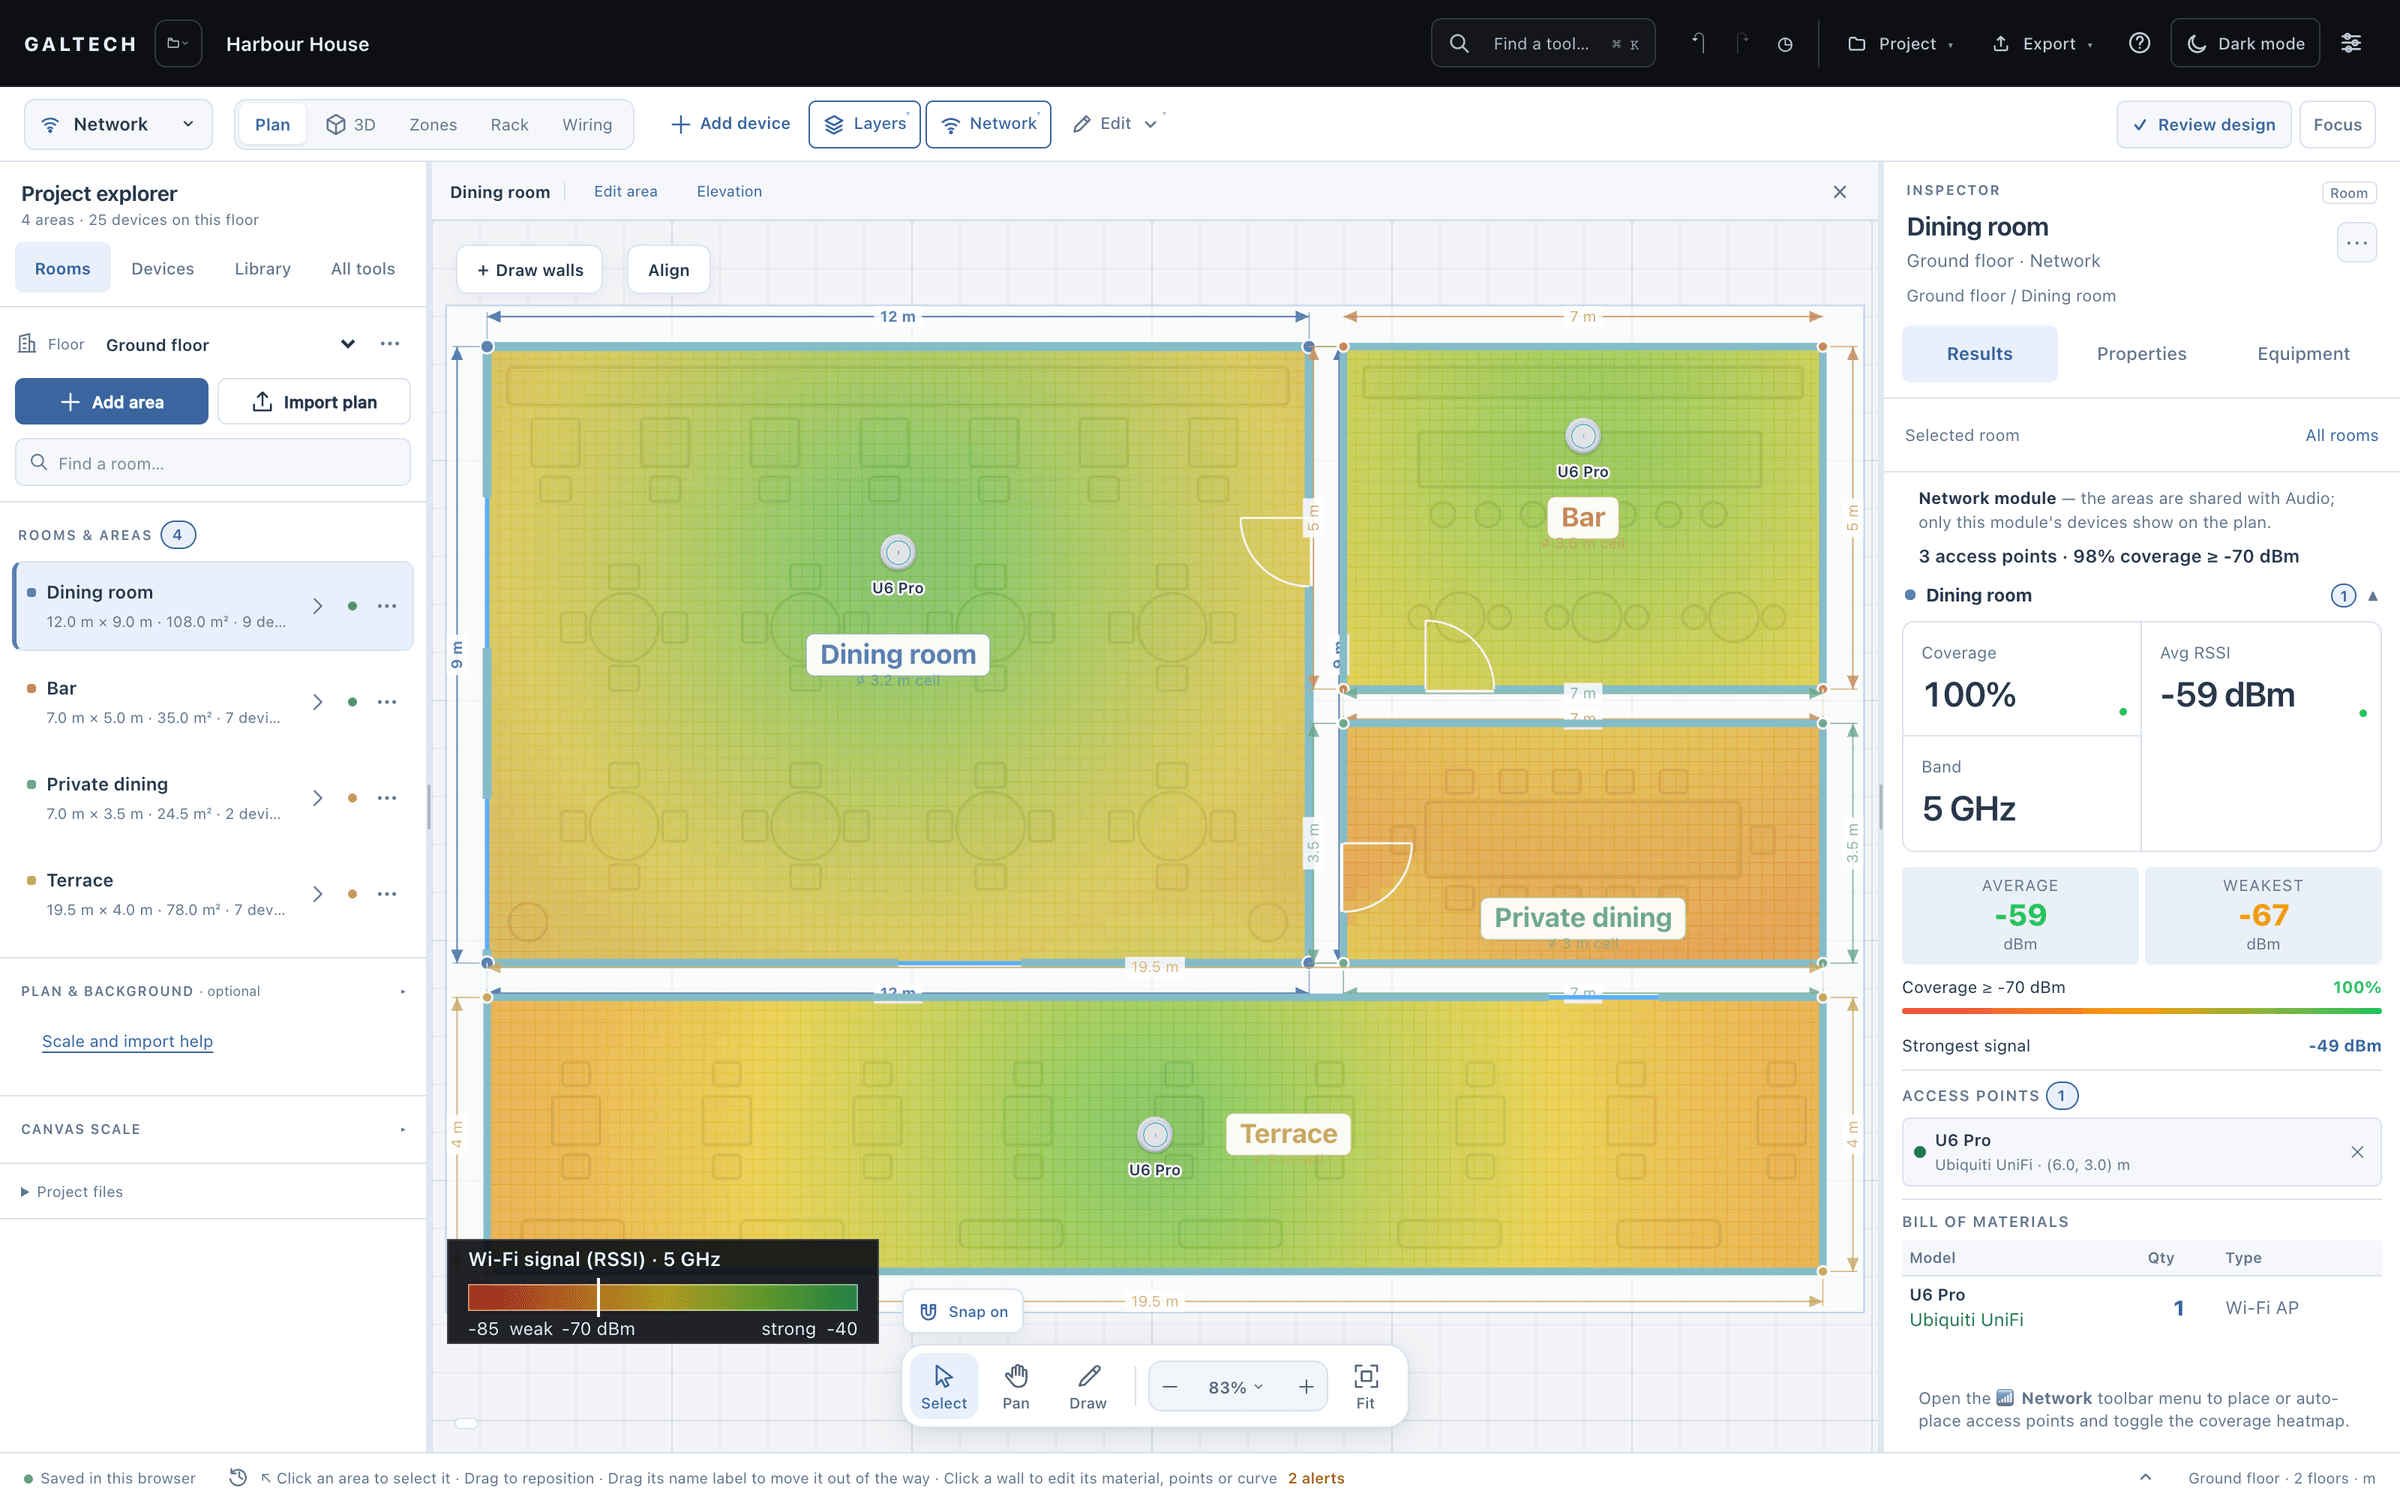
The areas and walls are the ones you already drew. Only the network devices show on the plan, and the Inspector shows the network results.
Give the project a wall material, then change the walls that differ: glass, brick, wood, concrete or drywall, one segment at a time.
Pick a model in the library, where Details lists its radios, bands and power draw, and click inside a room. Or set a target and let Auto-place fill every area.
Turn on the Wi-Fi coverage heatmap and choose the band in Network tools. Toggle it off and on to relate the colours to the walls.
Each area reports its coverage, average, strongest and weakest signal. Equipment brings the ports and PoE of access points, cameras and control panels together before you choose a switch.
reading the map
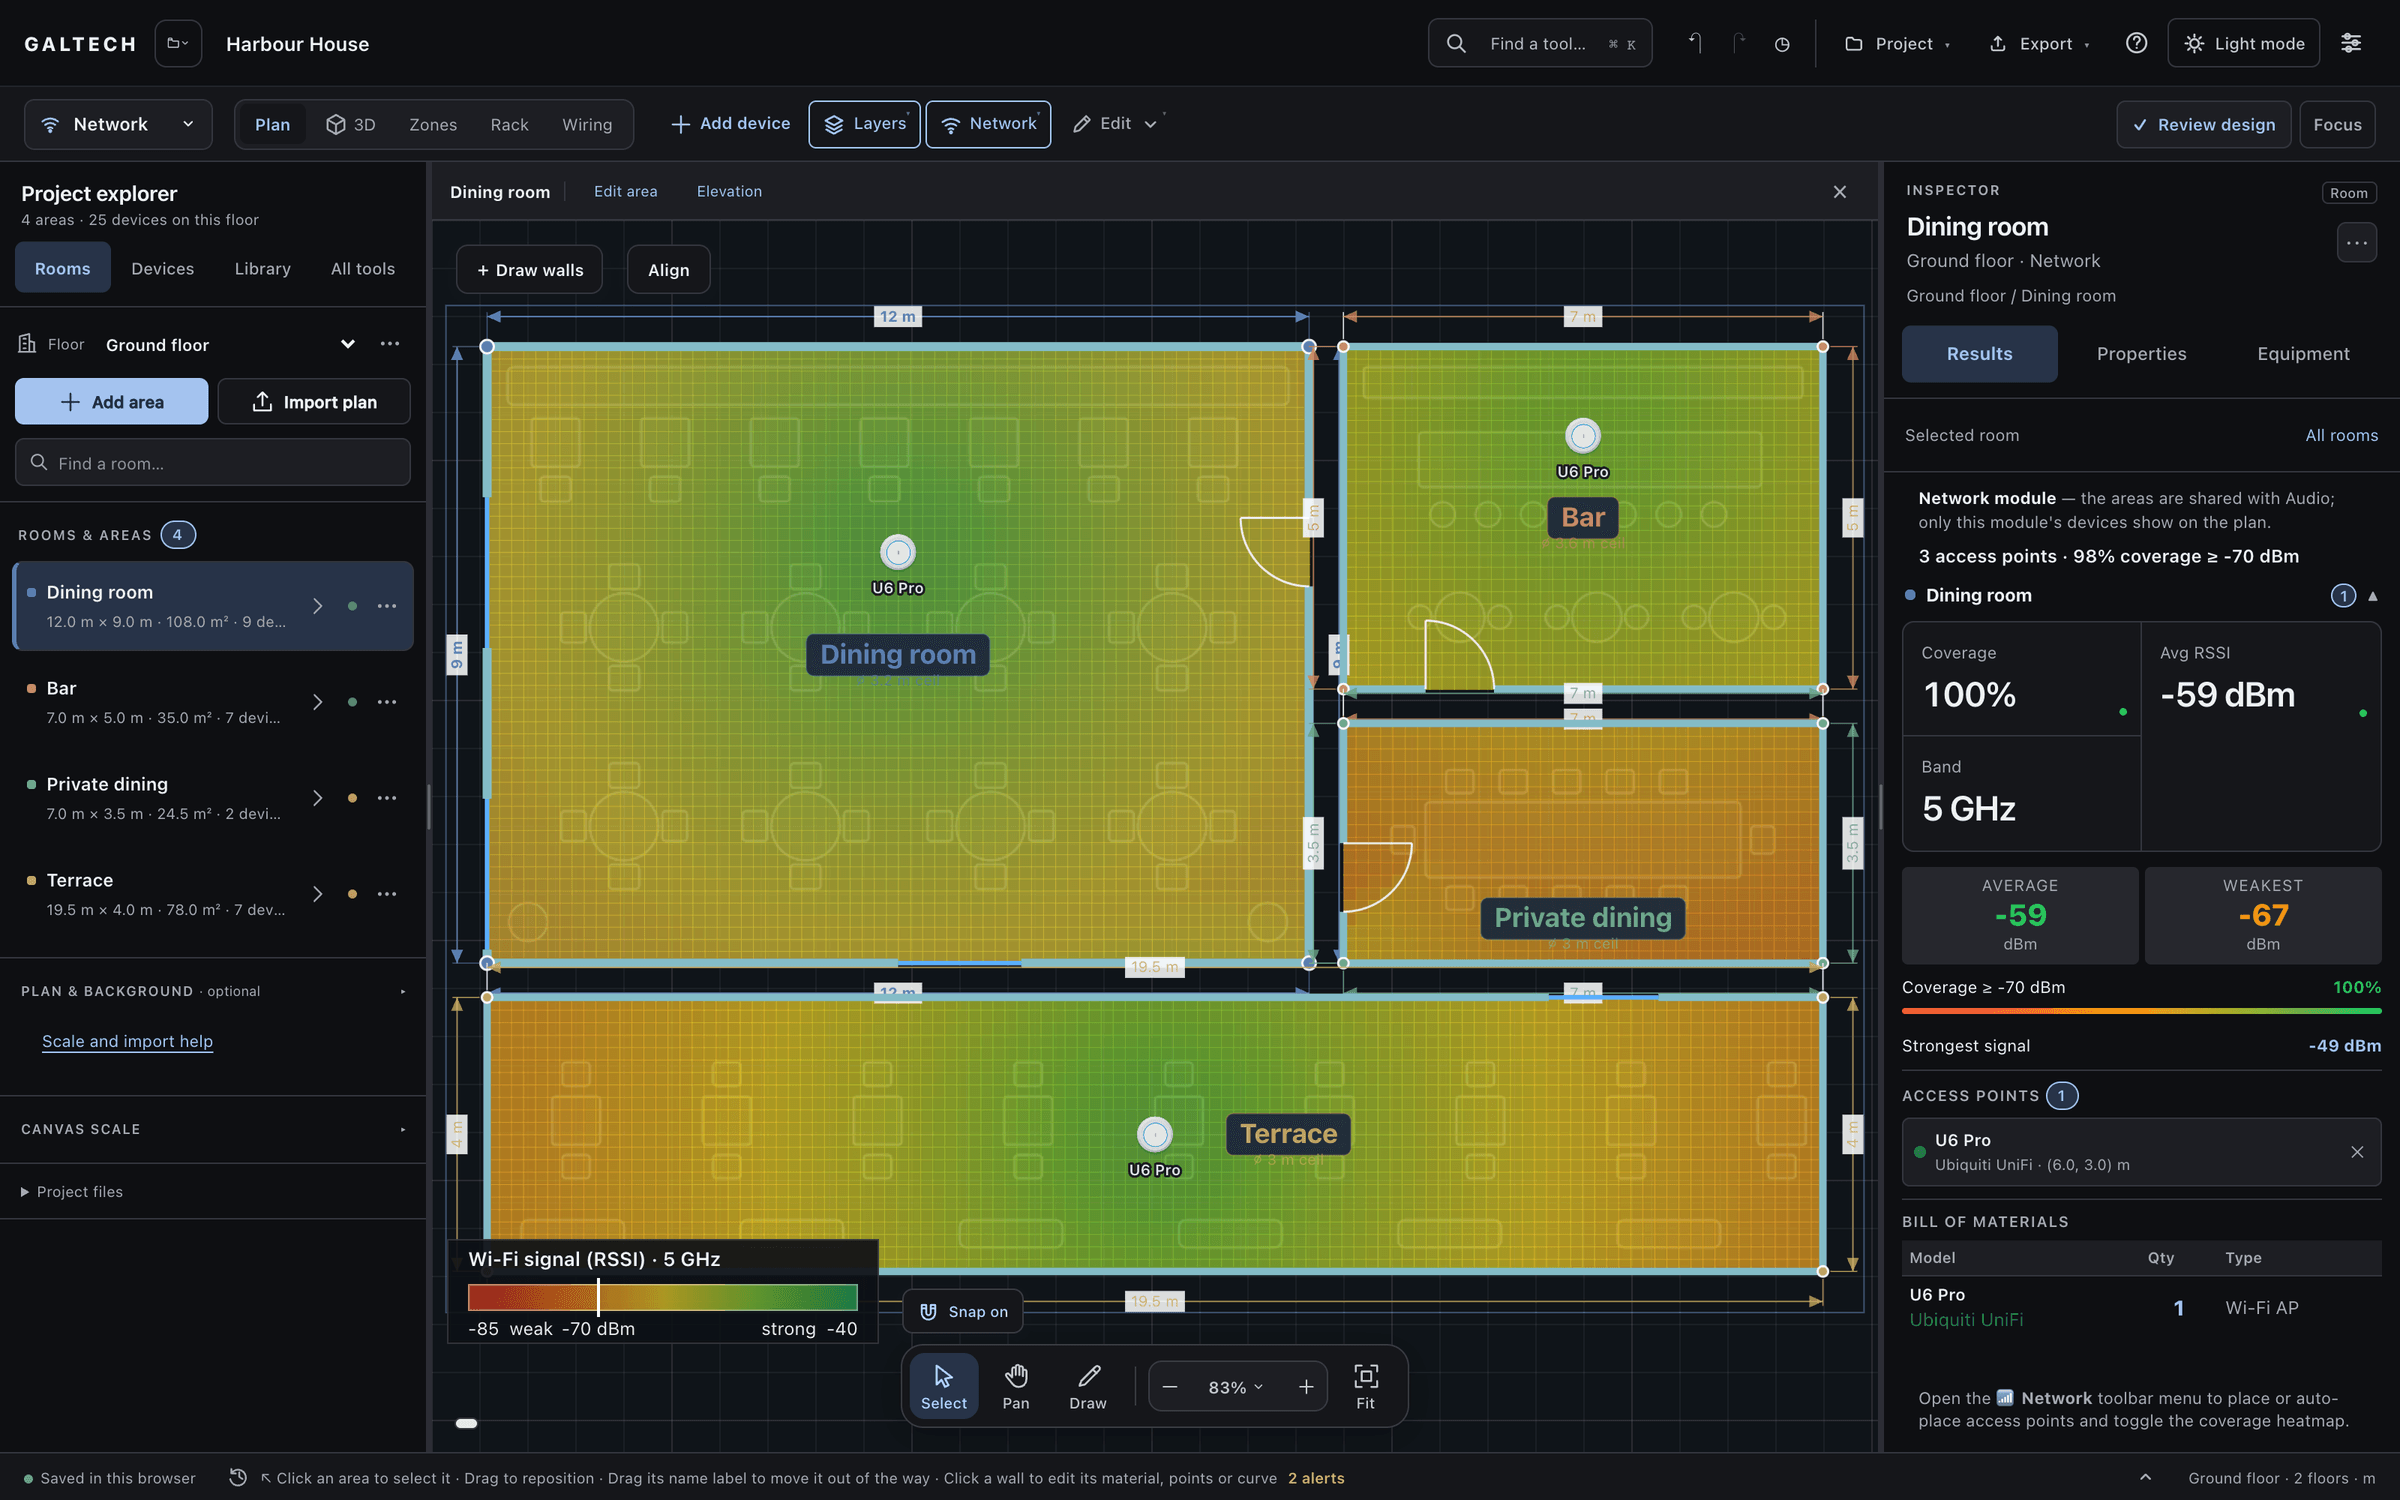
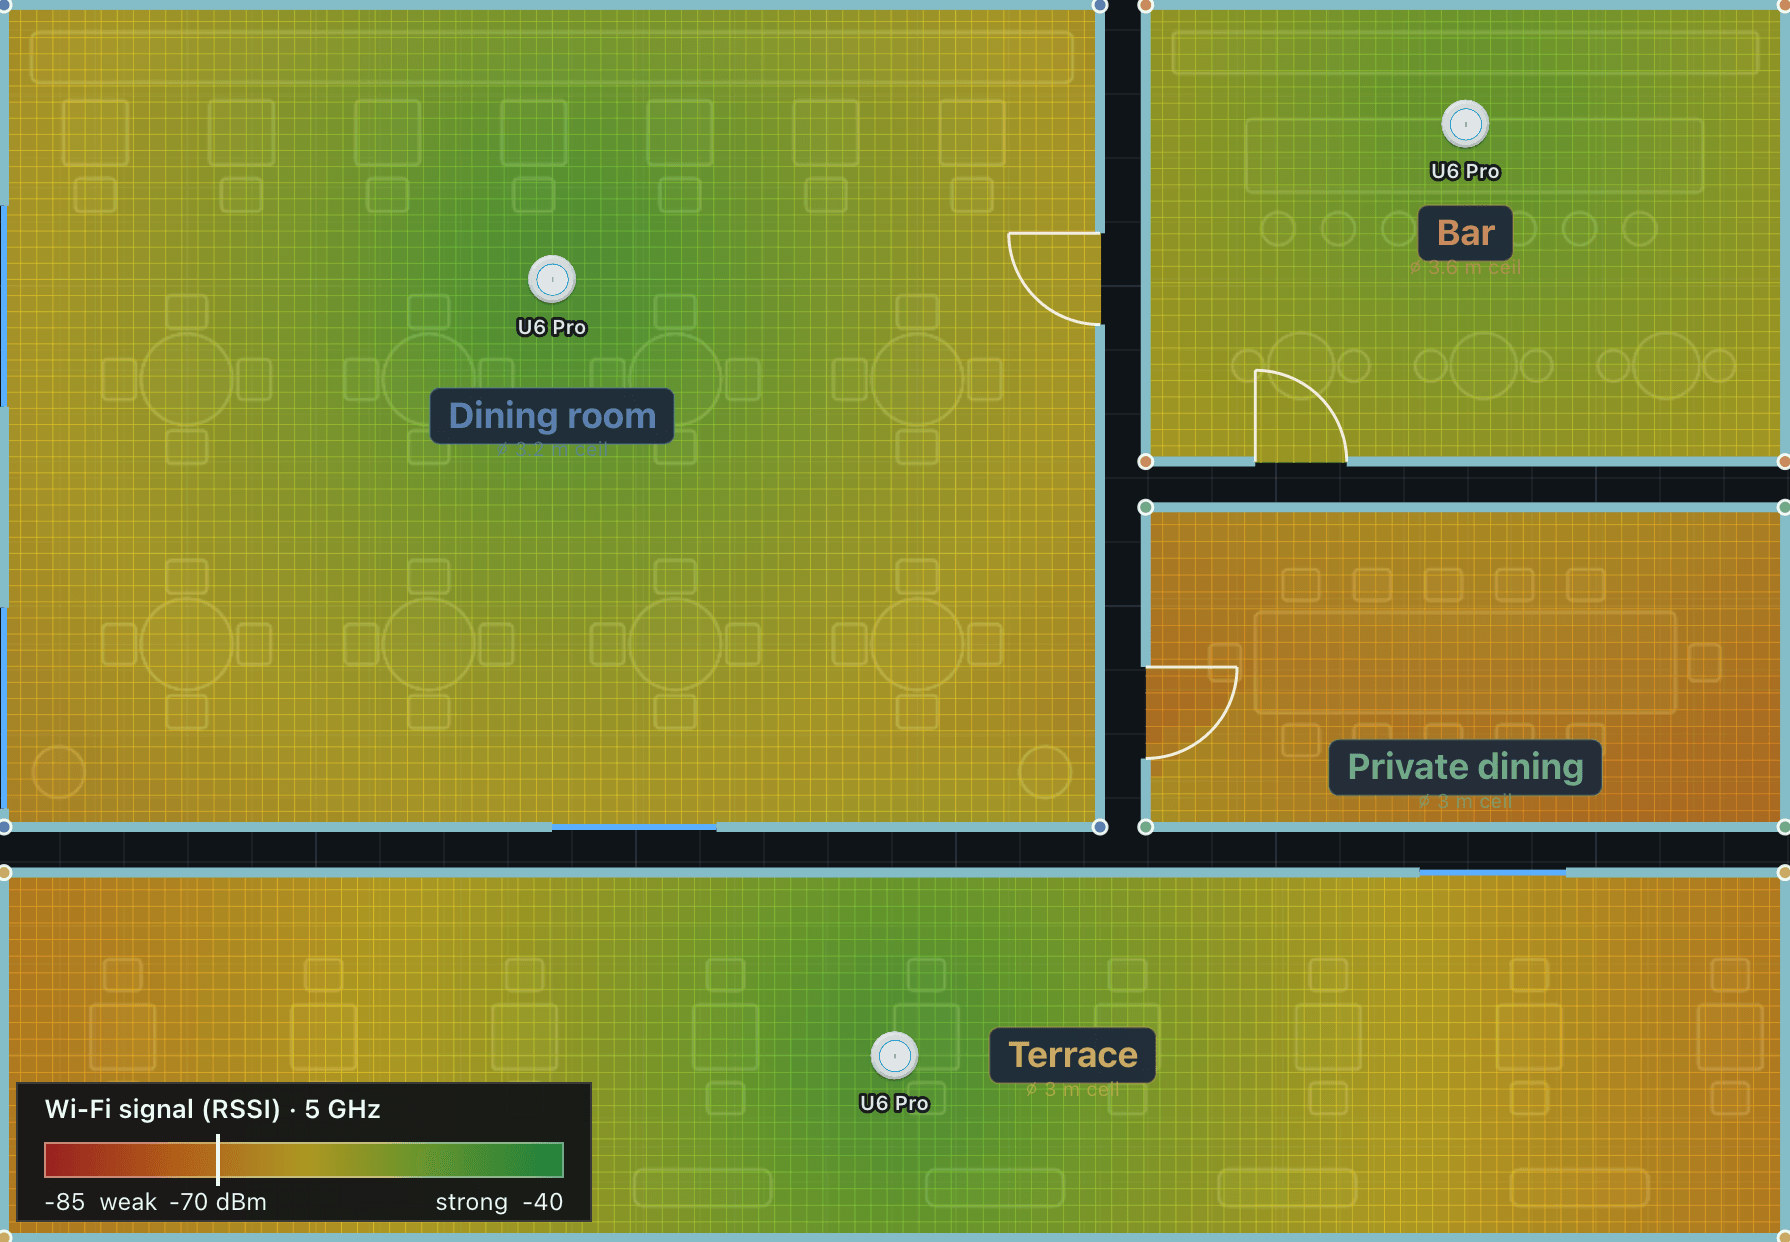
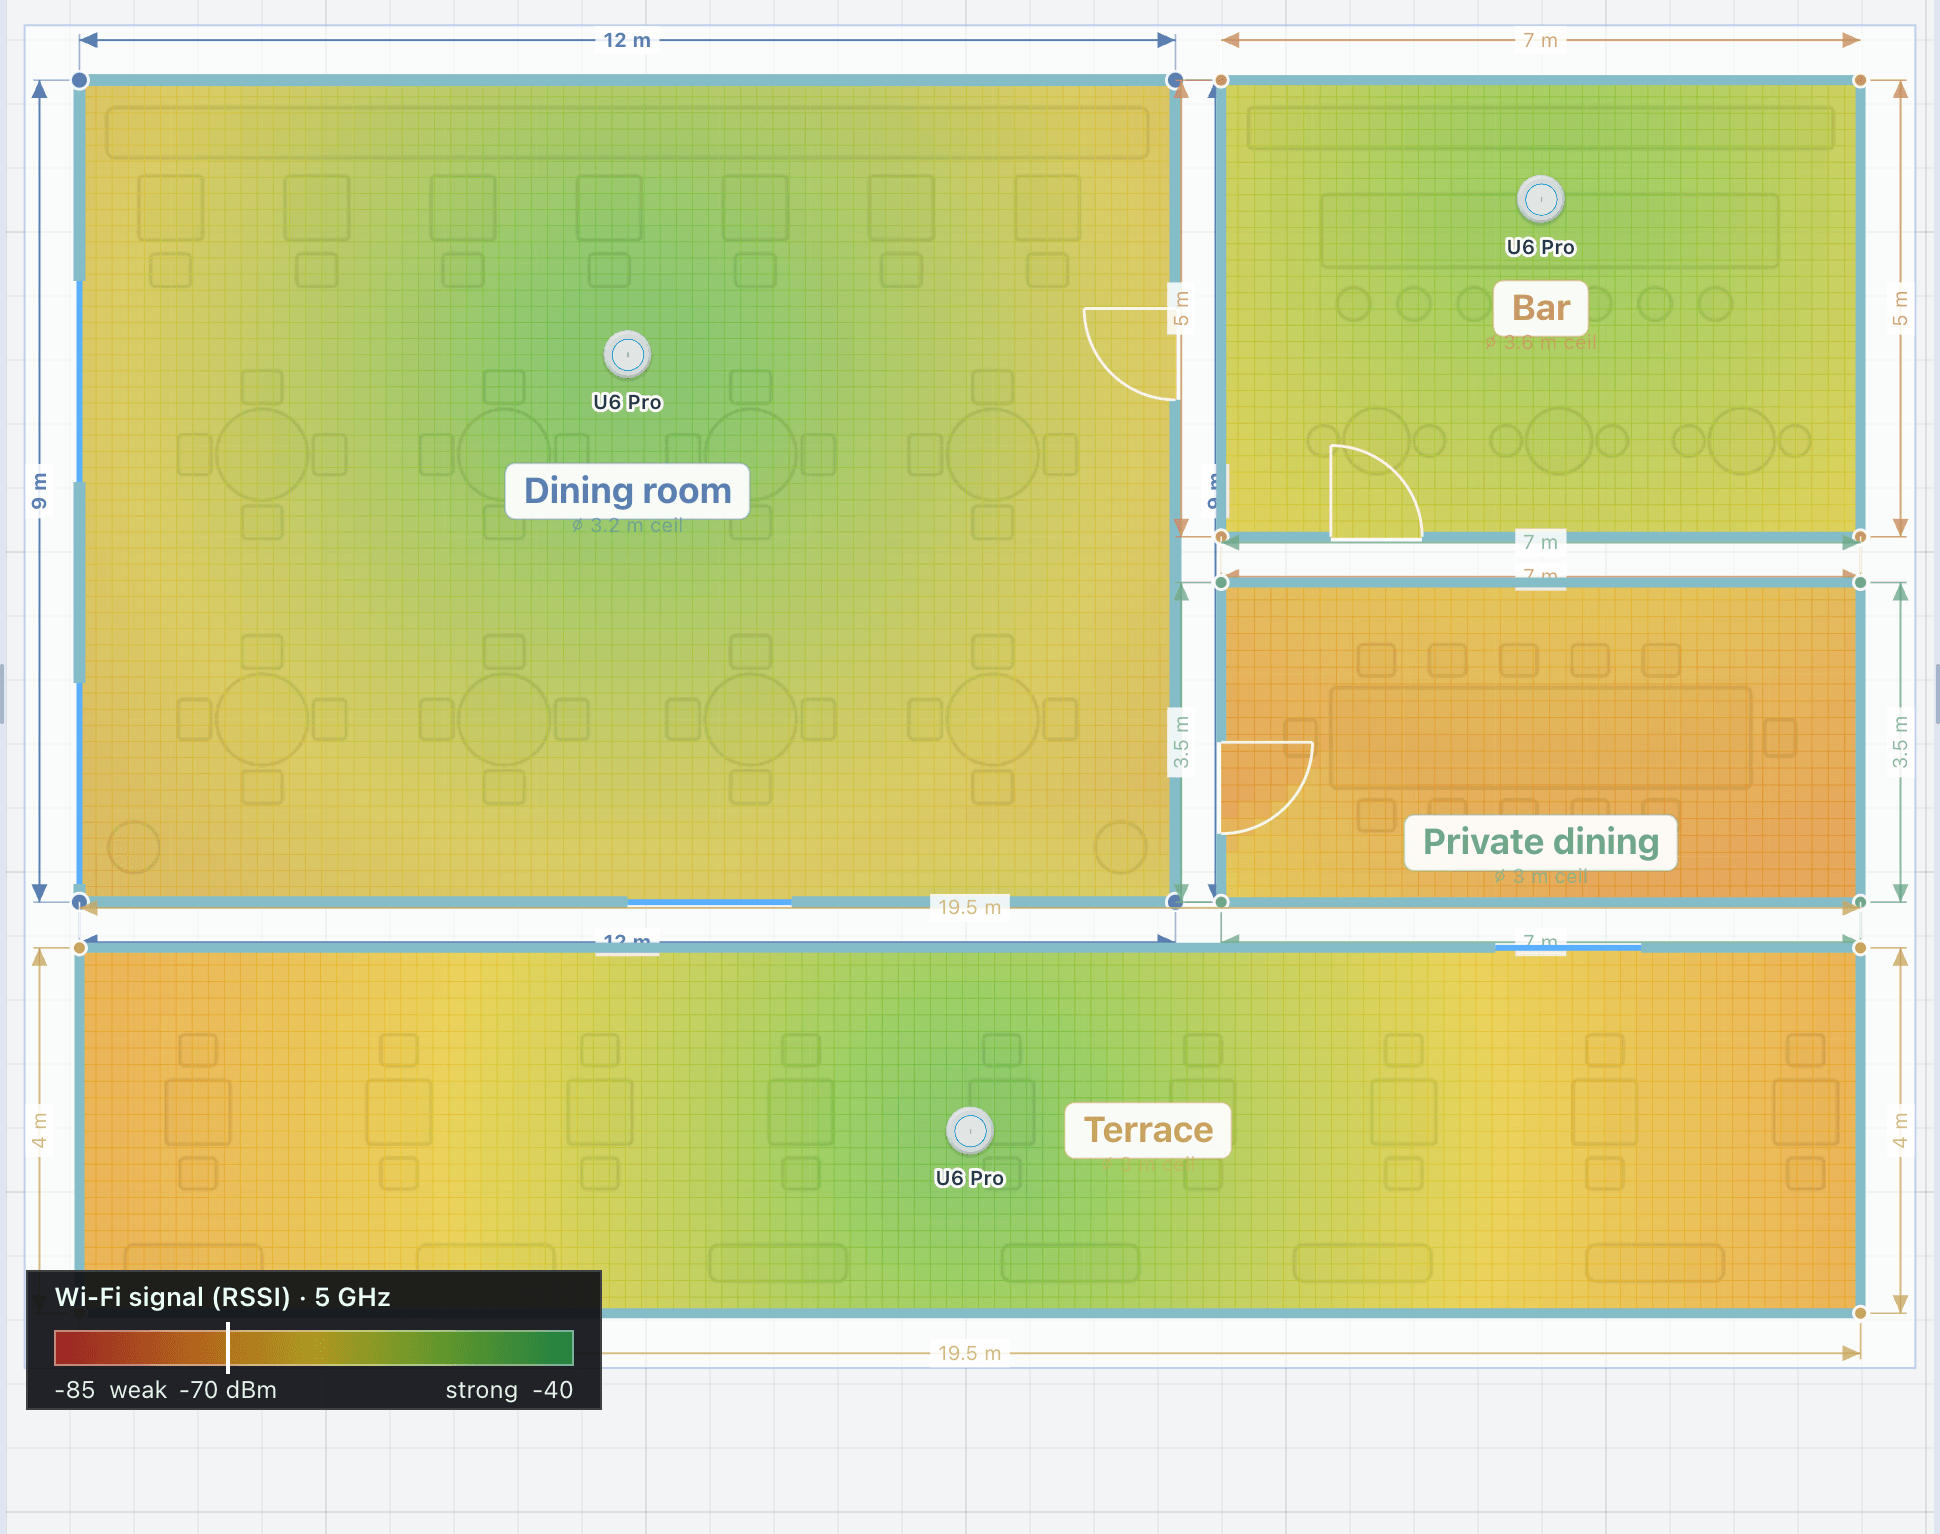
The heatmap colours each room by predicted signal strength. A glass partition barely touches the signal; a concrete wall takes a large bite out of it.
Signal strength (RSSI), dBm
Strong signal, close to an access point or through walls that cost it little.
Usable signal. Judge it against the room: a bedroom tolerates less than a home office.
Weak signal. Move the access point towards it, or add one, and watch the numbers change.
the analysis
No standard grades Wi-Fi coverage here. The figures are predictions to plan and quote with, then to confirm on site.
what you hand over, 04
Its own branded PDF: the coverage map, the access point schedule with mounting locations, and the switch summary. It joins the combined report too.
For: Client and installer
Access points carry AP1, AP2 references in the report that match the location schedule, so the installer finds each one on the plan.
For: Installer
Build from project draws every access point wired to the network switch over PoE, each link with a cable ID in the connection schedule.
For: Installer
Switches drop into the rack with a patch panel per 24 ports, and access points are priced lines in the client proposal and the bill of materials.
For: Office
in the catalogue
20
18 named models and 2 generic ones.
10
In the rack and gear library, with their ports and PoE.
Counts are the tool’s built-in catalogue in v2.0.0. Brand and product names in the catalogue belong to their owners. A product in the catalogue does not mean a partnership.
honest limits
The map predicts signal from the access points and the walls you set. Furniture, people and the building as built change it, so validate the coverage on site with a survey tool.
An unset or wrong wall material changes the result, and so does the band. Check the walls before you trust a map, and check each band you plan to use.
The tool counts the networked devices and warns when ports run short. Confirm the port count and the PoE budget in Equipment before you choose the switch.
faq
No. It predicts coverage so you can place the access points and quote them. Validate the radio coverage on site with a survey tool, because furniture and people change it.
2.4, 5 and 6 GHz, each with its own heatmap. Walls absorb the bands differently, so check each one you plan to use.
Paid accounts can add their own products, switched on per account on request. It is not part of the trial.
A custom device takes its ports, PoE draw and rack units, and joins the library, the rack, the wiring diagram and the bill of materials.
It can be. Each discipline prints its own branded PDF, or every system goes into one combined report.
keep going
Access points, walls and bands on the same plan as the audio, CCTV, video and control.
15-day trial for approved companies. No card, nothing to cancel.