Audio
Read coverage and the SPL heatmap
Read the predicted sound level across a room, tighten the colour scale to see detail, use the map layers that matter, and turn the results into layout choices.
On this page
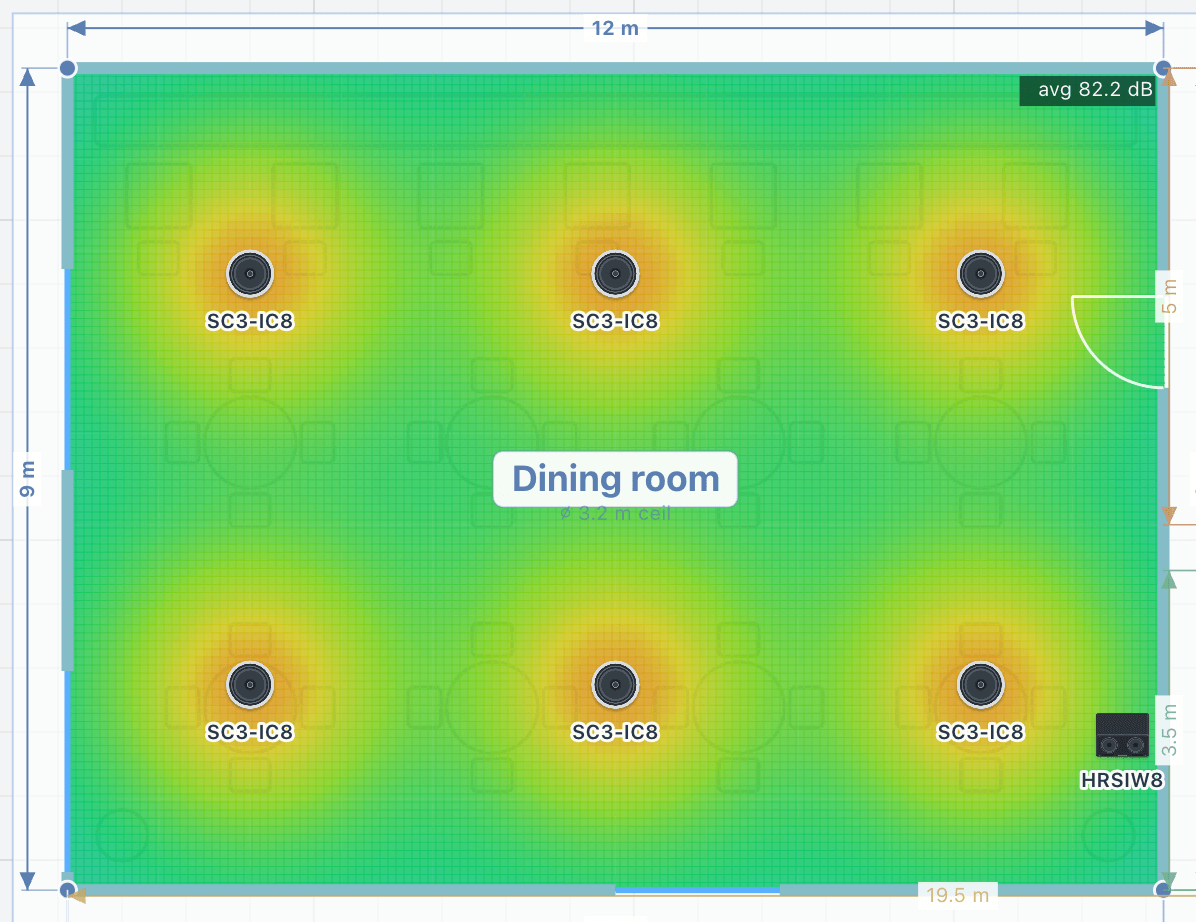
The heatmap paints the predicted sound pressure level, in decibels, across the floor at ear height. Read it like a weather map: warm colours are loud and cool colours are quiet. What you want is an even colour wherever people will be, with no cold corners and no hot spots under the speakers.
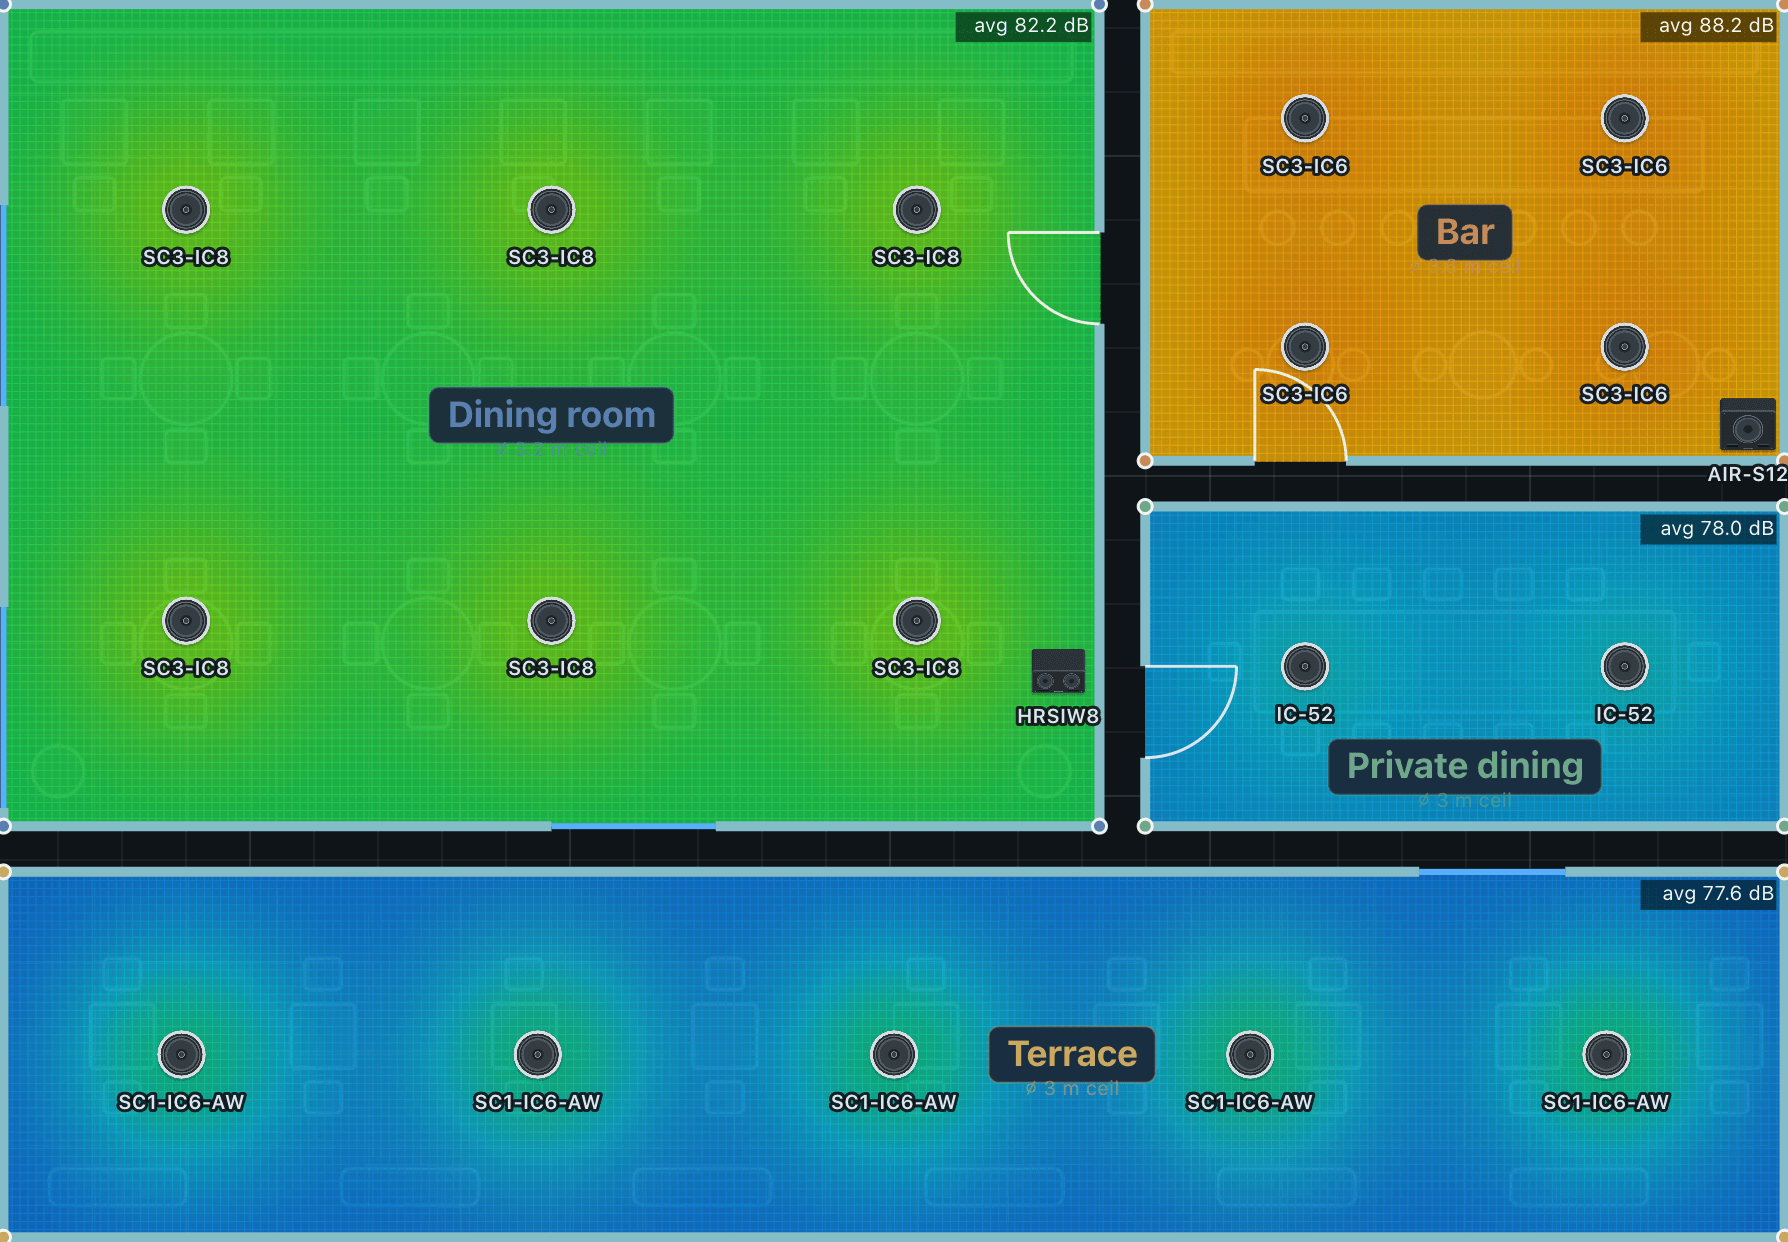
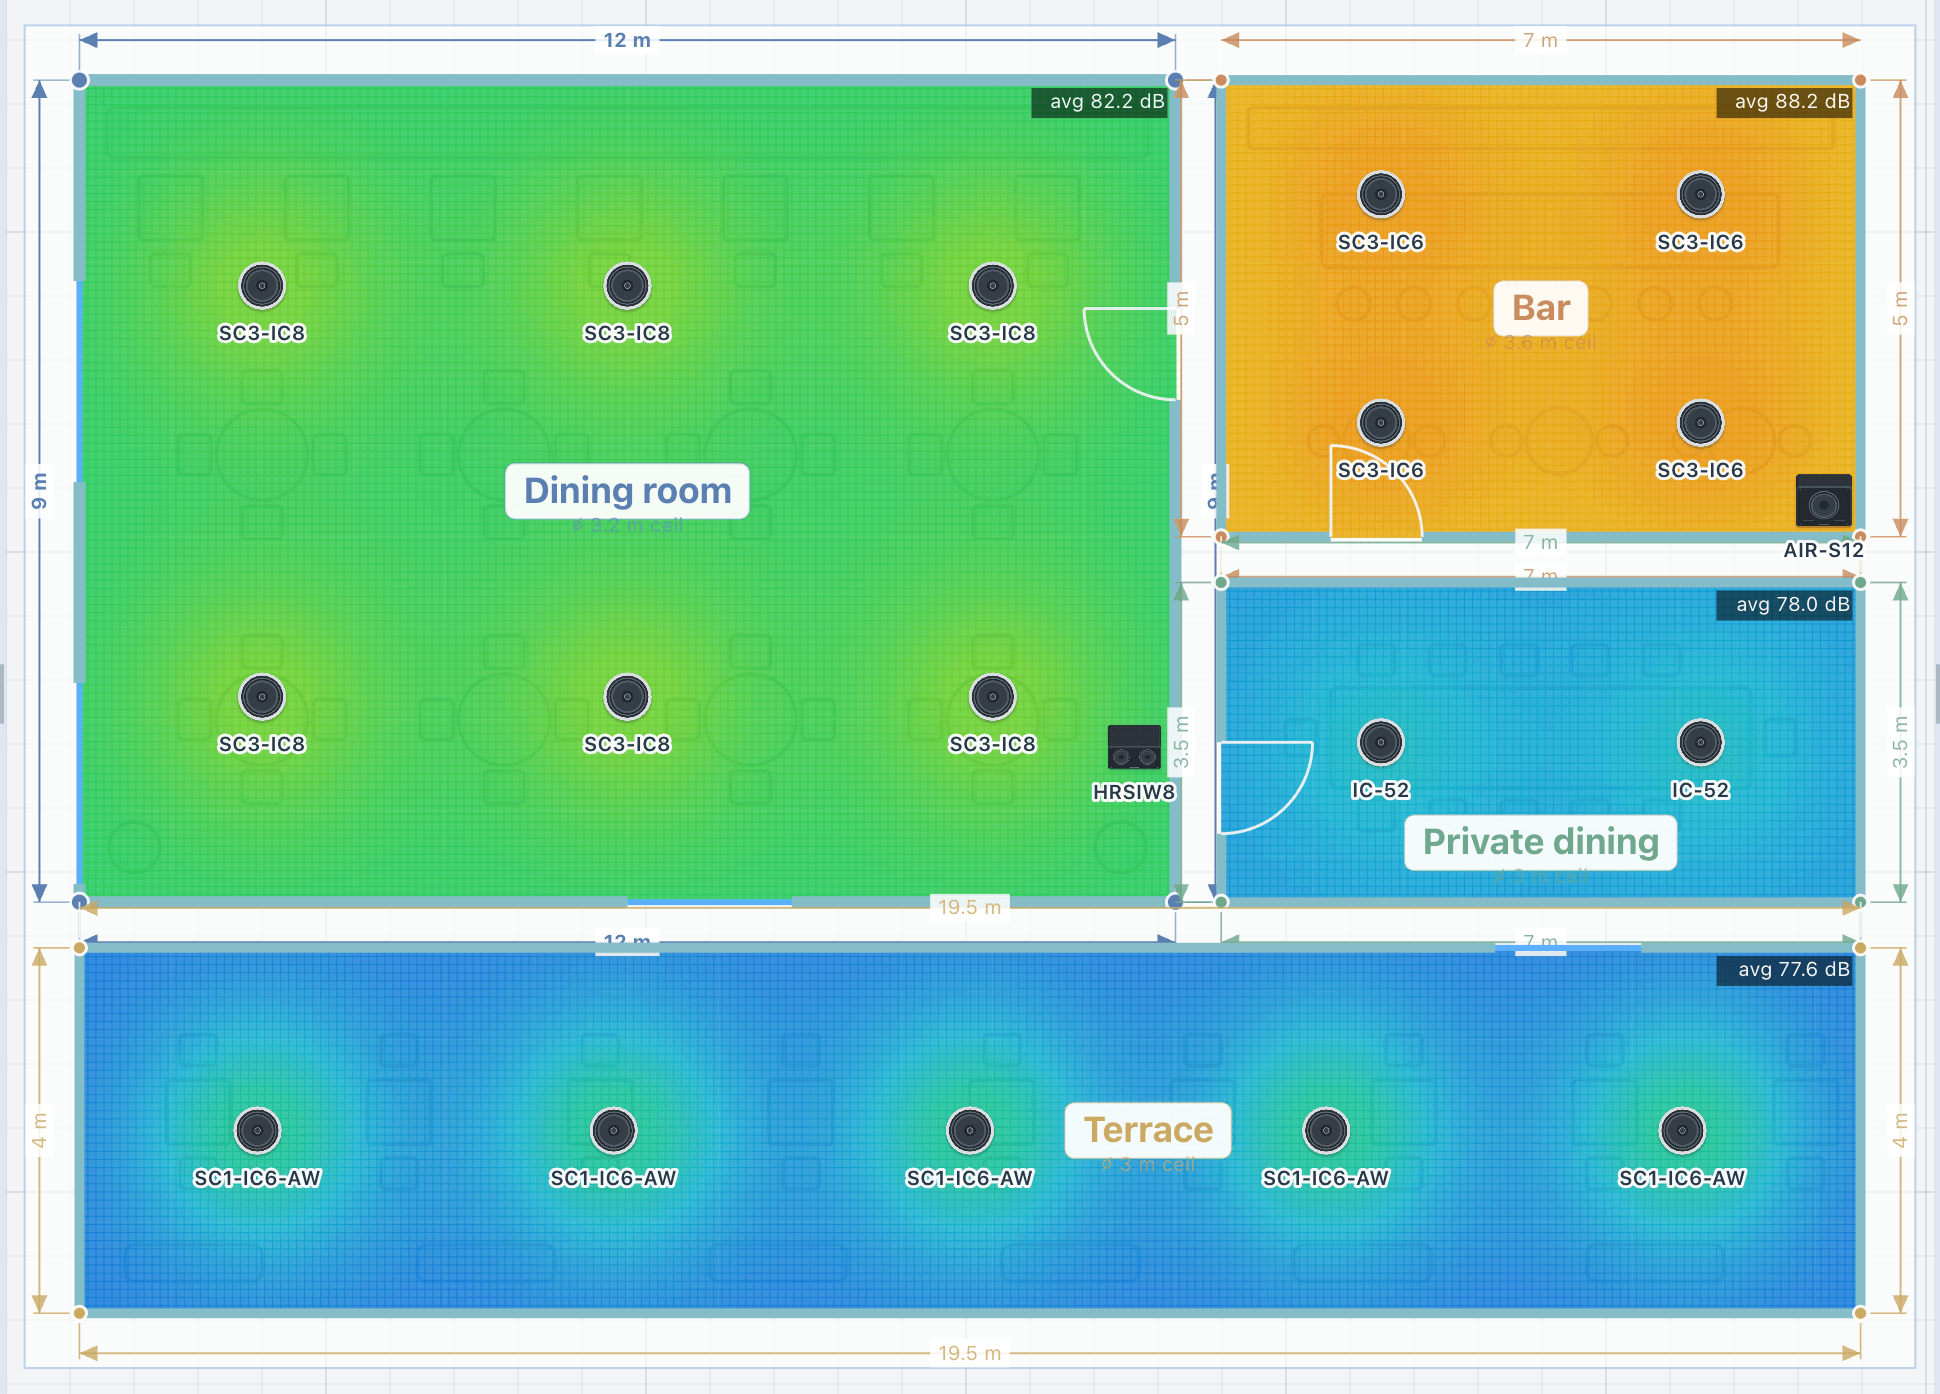
Check the coverage of an area
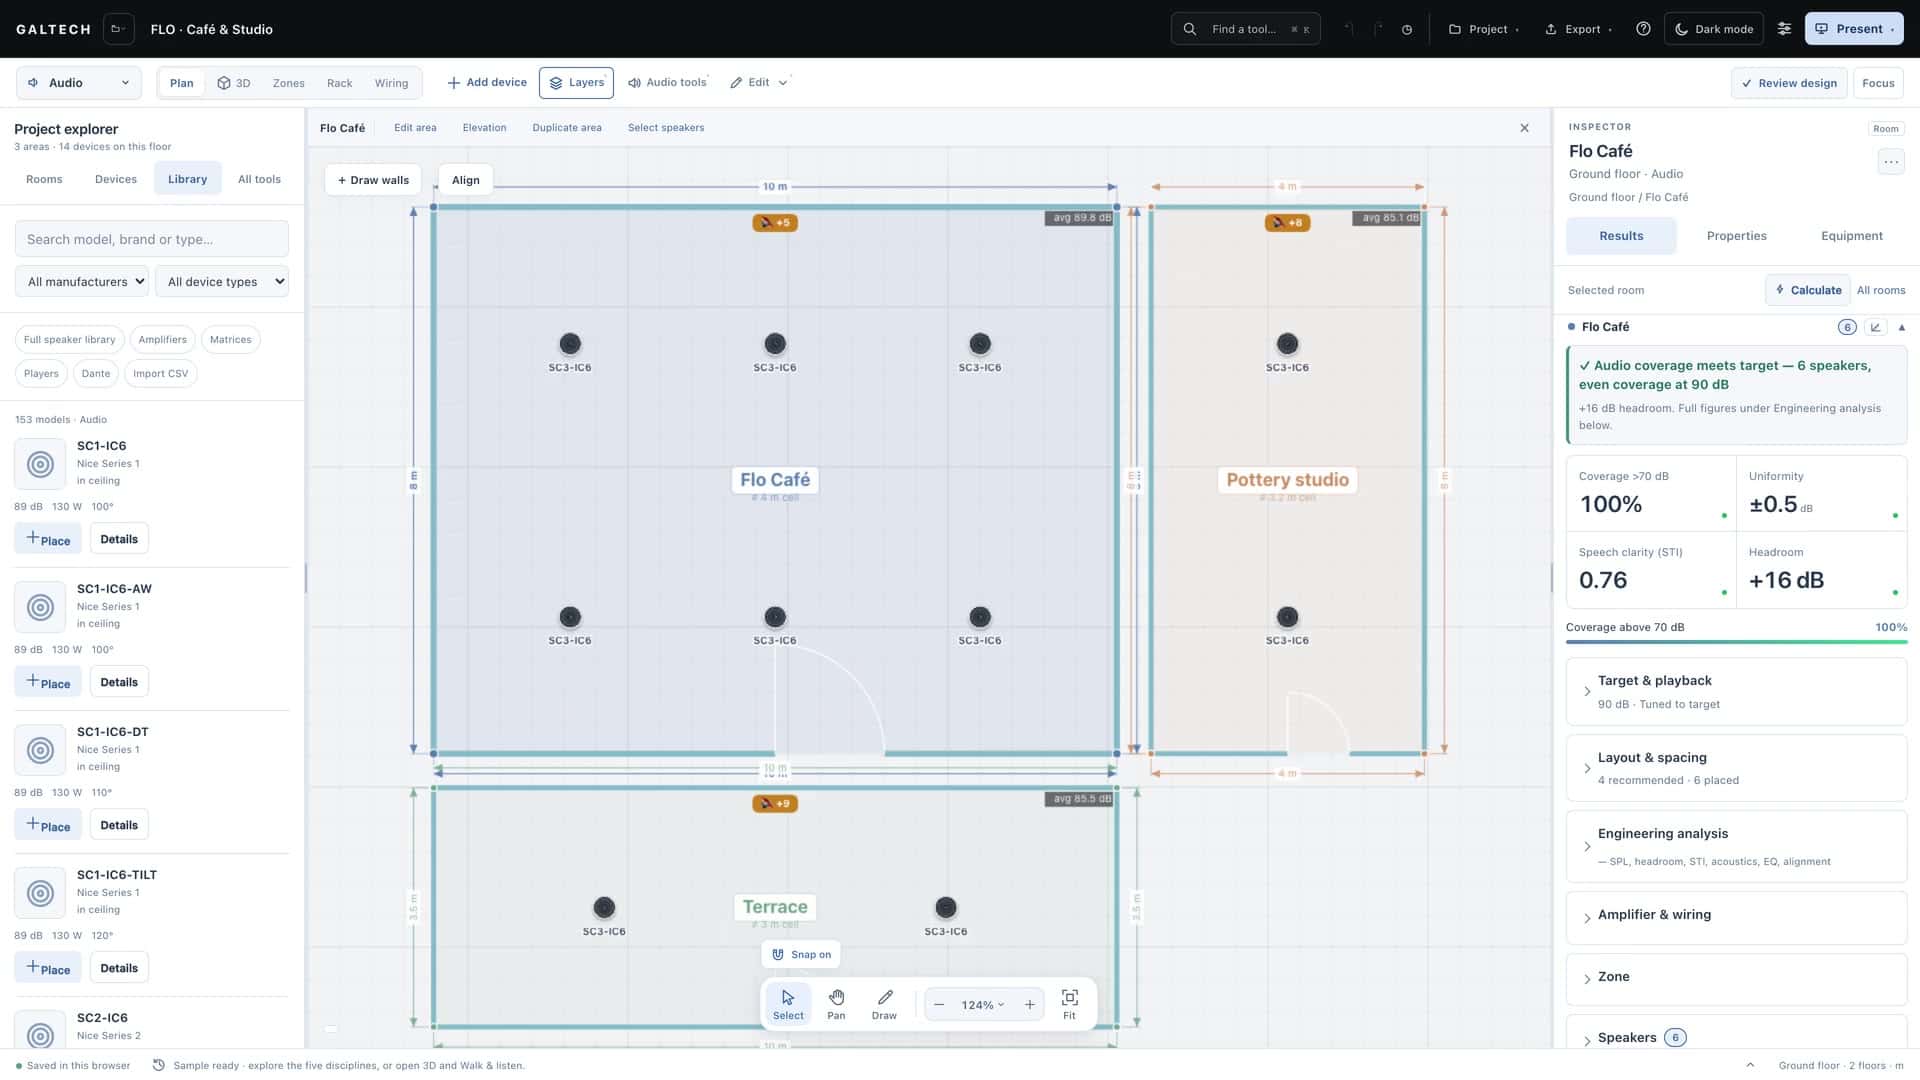
- Check the room and its target. Select the area and choose Edit area. Check the length, width, ceiling, ear level and RT60, then close the editor. Open Results → Target & playback to check the level the room has to reach.
- Read the heatmap against its scale. In Layers, turn on SPL heatmap and Coverage circles. Expand Heatmap Scale in the Inspector and compare the occupied part of the room with its decibel legend. Look for quiet gaps and for heavy overlap.
- Refine and review. Move one speaker at a time and compare the updated results. Expand Amplifier & wiring to see what the system needs, then check the weakest listening positions and the uniformity before you prepare the report.
How to read the colours
- Red and orange, near a speaker: a high level.
- Green and yellow: the comfortable listening level.
- Blue, in corners or far away: the level is dropping off.
Aim for mostly green to yellow across the seating, with no large blue gaps and no tight red hot spots. A wide spread of colours means uneven coverage: add or move speakers.
Tighten the scale to see detail
The colours stretch across the scale’s minimum and maximum, 80 to 110 dB by default. Narrow it, say to 75 to 90 dB, and differences of a decibel or two become obvious; widen it for the general picture. The legend always shows the range in use. You set the range at the bottom of the Layers menu.
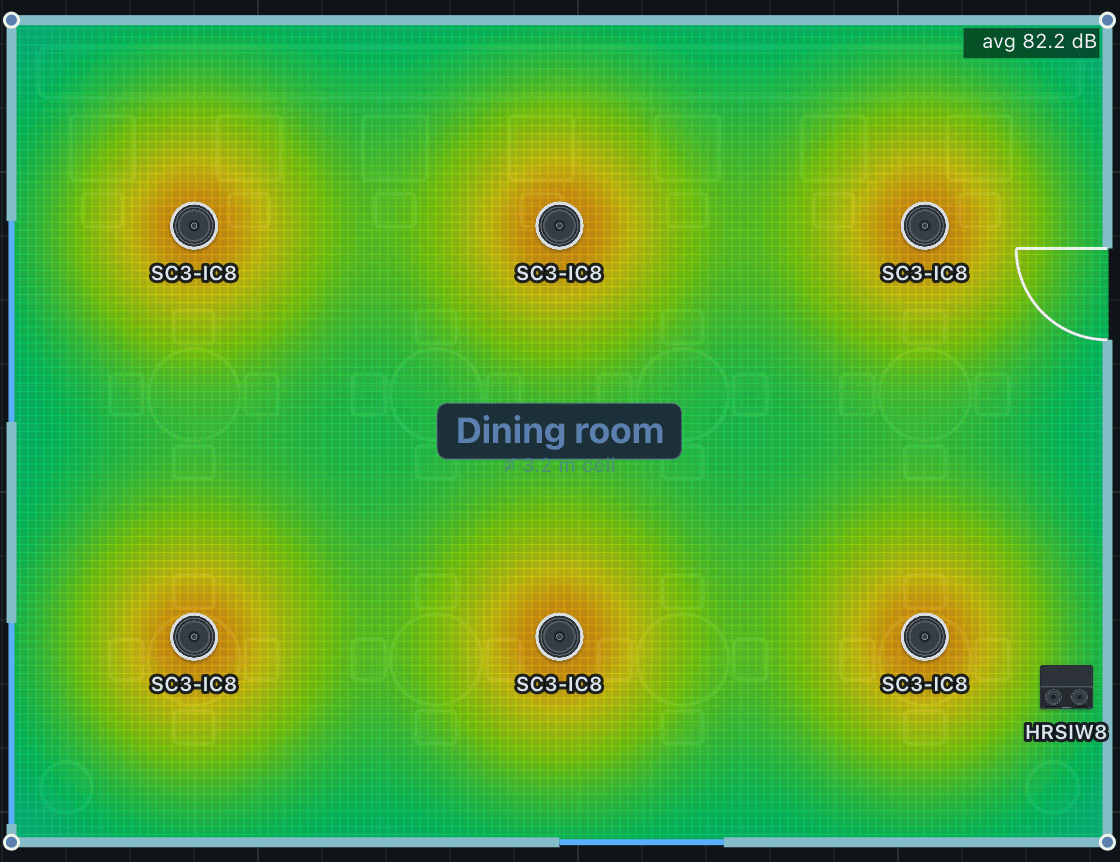
Coverage circles or heatmap
The coverage circles are each speaker’s own reach, coloured from red, loud and on axis, to green at its useful edge. The heatmap is the combined level of every speaker in the area. Use the circles to aim one speaker and the heatmap to judge the room: the circles are a quick sketch, the heatmap is the calculation.
The layers that matter
| Layer | What it shows |
|---|---|
| SPL heatmap | The predicted level across the floor. |
| Coverage circles | Each speaker’s reach. |
| Contours | Lines of equal level, like height lines on a map. The SPL / D/R switch changes the map to the direct-to-reverberant ratio, which tracks clarity in a reverberant room. |
| Labels, Dimensions | Speaker numbers, area sizes and the distances to the walls. |
| Tuned levels | On by default: each speaker is turned down to the area’s target, as you would set the gains on site. |
| Interference | Combines the speakers as real sound waves, to show the ripple where their coverage overlaps. |
| Colourblind-safe colours | A violet to yellow ramp that every common type of colour vision can read. |
Tuned levels
With Tuned levels on, the map shows a commissioned installation: every speaker level-matched down to the target, so a higher-output model does not look hotter than its neighbours. A speaker that cannot reach the target stays at its maximum, so real gaps still show. Turn it off to see every speaker at full rated power, how loud the system can go. The button in Layers sets the whole project; each area also has its own, so a restaurant can be tuned to target while a demo area runs at full power.
Interference
The normal map adds the speakers’ energy, which is the right view for layout decisions. Interference adds them as waves instead, showing the comb-filter peaks and dips where two speakers overlap: the ripple you would measure with a meter. Use it to judge overlap and stereo blending, with the grid set to Fine.
The numbers behind the colours
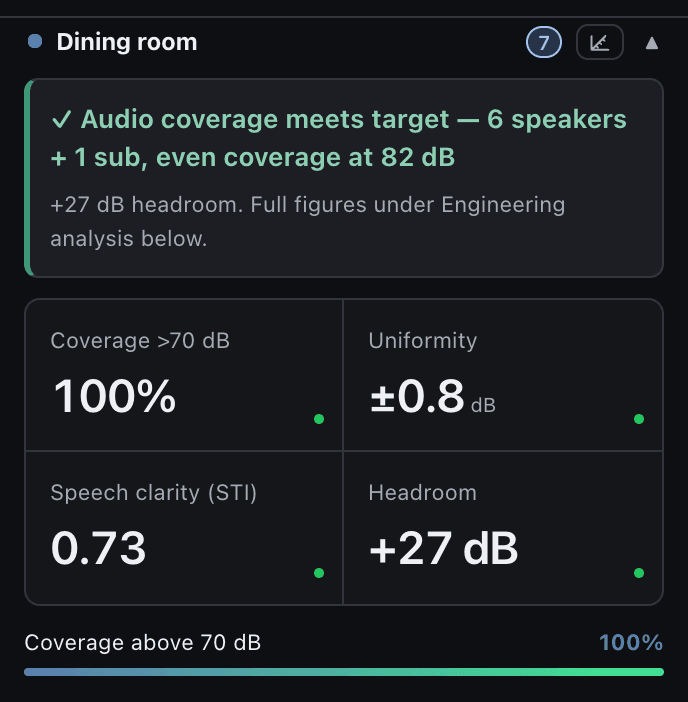
The Inspector’s Results summarise what the colours show, area by area: the minimum, maximum and average level, the uniformity as a ± spread in decibels (smaller is more even), the share of the area above the coverage threshold, the speech intelligibility (STI) and the headroom. Frequency response, STI and the standards check explains the full engineering analysis.
Note
Calculated coverage is a design estimate. Confirm the installed system with measurements during commissioning.